A
B
C
D
Text Solution
Verified by Experts
The correct Answer is:


Topper's Solved these Questions
Similar Questions
Explore conceptually related problems
MOTHERS-DATA INTERPRETATION-MULTIPLE CHOICE QUESTIONS
- The actual production of Ac machines in April was that percentage mor...
Text Solution
|
- In which month the actual production of AC machines was 25% more than ...
Text Solution
|
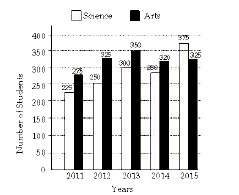
- The given Bar graph present the number of students from Science and Ar...
Text Solution
|
- The given Bar graph present the number of students from Science and Ar...
Text Solution
|
- What is the ratio of the total number of science students in 2011 and ...
Text Solution
|
- The given Bar graph present the number of students from Science and Ar...
Text Solution
|
- The given bar graph Presents the Demand and Production of motorcycle o...
Text Solution
|
- What is the ratio of the total Demand of motorcycles of companies A an...
Text Solution
|
- The total production of motorcycles of companies B and D taken togethe...
Text Solution
|
- The company in which the production of motorcycles is approximately 26...
Text Solution
|
- The given bar graph presents Different type of Vehicles exported by a ...
Text Solution
|
- The given bar graph presents Different type of Vehicles exported by a ...
Text Solution
|
- In given bar graph presents the number of different types of vehicles ...
Text Solution
|
- The given bar graph presents the number of different types of vehicles...
Text Solution
|
- The given bar graph presents the number of students enrolled for a voc...
Text Solution
|
- The given Bar Graph presents the number of students enrolled for a voc...
Text Solution
|
- What is the ratio of the total numbers of students enrolled in A durin...
Text Solution
|
- In which year the number of students enrolled in B is x^6more , where ...
Text Solution
|
- the given bar graph presents income and Expenditure of a company for t...
Text Solution
|
- the given bar graph presents income and Expenditure of a company for t...
Text Solution
|