A
B
C
D
Text Solution
Verified by Experts
The correct Answer is:


Topper's Solved these Questions
Similar Questions
Explore conceptually related problems
MOTHERS-DATA INTERPRETATION-MULTIPLE CHOICE QUESTIONS
- The total production of motorcycles of companies B and D taken togethe...
Text Solution
|
- The company in which the production of motorcycles is approximately 26...
Text Solution
|
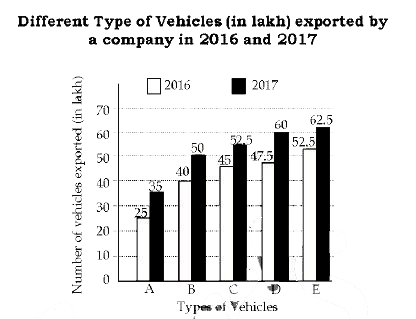
- The given bar graph presents Different type of Vehicles exported by a ...
Text Solution
|
- The given bar graph presents Different type of Vehicles exported by a ...
Text Solution
|
- In given bar graph presents the number of different types of vehicles ...
Text Solution
|
- The given bar graph presents the number of different types of vehicles...
Text Solution
|
- The given bar graph presents the number of students enrolled for a voc...
Text Solution
|
- The given Bar Graph presents the number of students enrolled for a voc...
Text Solution
|
- What is the ratio of the total numbers of students enrolled in A durin...
Text Solution
|
- In which year the number of students enrolled in B is x^6more , where ...
Text Solution
|
- the given bar graph presents income and Expenditure of a company for t...
Text Solution
|
- the given bar graph presents income and Expenditure of a company for t...
Text Solution
|
- The given Bar Graph presents Income and Expenditure (in crores of Rupe...
Text Solution
|
- the given bar graph presents income and Expenditure of a company for t...
Text Solution
|
- The given bar graph presents the Revenue and Expenditure of a company ...
Text Solution
|
- The expenditure of the company in 2017 is what percentage less than th...
Text Solution
|
- The total expenditure of the company from 2016 to 2018 is what percent...
Text Solution
|
- The given bar graph presents the Revenue and Expenditure of a company ...
Text Solution
|
- The given bar graph presents the results in terms of number of student...
Text Solution
|
- What is the average of failed students in five academic years?
Text Solution
|