A
B
C
D
Text Solution
Verified by Experts
The correct Answer is:


Topper's Solved these Questions
Similar Questions
Explore conceptually related problems
MOTHERS-DATA INTERPRETATION-MULTIPLE CHOICE QUESTIONS
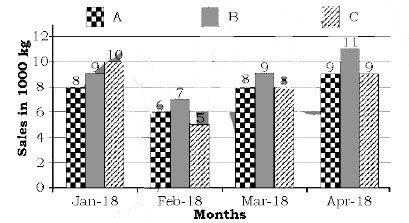
- The given Bar Graph present the sales of the number of books (in thous...
Text Solution
|
- The given Bar Graph present the sales of the number of books (in thous...
Text Solution
|
- The given bar graph present the sale of a particular brand of tea by ...
Text Solution
|
- The given bar graph present the sale of a particular brand of tea by ...
Text Solution
|
- The given bar graph present the sale of a particular brand of tea by ...
Text Solution
|
- The given bar graph present the sale of a particular brand of tea by ...
Text Solution
|
- The given bar graph presents the runs scored and strike rate of a bats...
Text Solution
|
- The given bar graph presents the runs scored and strike rate of a bats...
Text Solution
|
- The given Bar Graph presents the runs scored (A) and strike rate (B) o...
Text Solution
|
- What is the average run scored by the batsman man in the five matches?
Text Solution
|
- A book has been co-authored by X and Y. The prices of the book in Indi...
Text Solution
|
- A book has been co-authored by X and Y. The prices of the book in Indi...
Text Solution
|
- A book has been co-authored by X and Y. The prices of the book in Indi...
Text Solution
|
- A book has been co-authored by X and Y. the prices of the book in Indi...
Text Solution
|
- The given bar graph presents the data of annual income and annual expe...
Text Solution
|
- The given bar graph presents the data of annual income and annual expe...
Text Solution
|
- The given bar graph presents the data of annual income and annual expe...
Text Solution
|
- The given bar graph presents the data of annual income and annual expe...
Text Solution
|
- The full marks for a paper is 300. The breakup of the marks into theor...
Text Solution
|
- The full marks for a paper is 300. The breakup of the marks into theor...
Text Solution
|