Home
Class 14
MATHS
The given bar graph presents the sales o...

The given bar graph presents the sales of a particular brand of car by three showrooms, A,B and C during the months Jan,Feb ,Mar and Apr 2016

If the cars sold by A and B are all found to be in perfect order, but the cars sold by C were found to be defective to the extent of 15%,10% and 8% and 6% respectively in Jan,Mar and Apr 2016 What is the percentage of defective cars sold by all showrooms during Apr 2016?

A

A. `4 4/9`

B

B.`1 3/7`

C

C. `2 4/9`

D

D. `7 2/3`

Text Solution

Verified by Experts

The correct Answer is:
B
Promotional Banner

Topper's Solved these Questions

  • COMPOUND INTEREST

    MOTHERS|Exercise CLASS ROOM EXERCISES |180 Videos
  • GEOMETRY

    MOTHERS|Exercise MULTIPLE CHOICE QUESTIONS |413 Videos

Similar Questions

Explore conceptually related problems

The given Bar Graph presents the sale (in 1000 kg ) of a particular brand of tea by three outlets, A,B, and C during the months Jan,Feb ,Mar and Apr,2018. What is average sales per month by A during Jan-Mar,2018?

The given Bar Graph presents the sale of a particular brand of car by three showrooms, A, B and C (in multiples of 100) during the months Jan, Feb, Mar and Apr, 2016. What is the ratio of number of cars sold by A in Jan-Feb, 2016 to that of cars sold by B during Mar-Apr, 2016?

The given bar graph present the sale of a particular brand of tea by three outlets A,B and C during the months Jan, feb , mar and Apr 2018. What is the ratio rate of growth in sales from B to the rate of growth in sales from C in mar 2018 with reference to its previous month ?

The given Bar Graph presents the sale (in 1000 kg) of a particular brand of ten by three outlets , A,B and C during the months Jan,Feb,Mar and Apr,2018 Arrange the ratio of sales from B to that from A and C, taken together,month wise in ascending order.

The given bar graph represents the sale of cars in five different states in a month. Which state sold 5000 cars ?

The given bar graph represents the sale of cars in five different states in a month. Which state sold maximum number of cars ?

The given bar graph presents the sale of a particular brand of car by three showrooms, A, B and C( in multiples of 100) during the months of Jan, Feb, Mar and Apr, 2016 दिया गया दंड आरेख (बार ग्राफ) तीन शो-रूम- A, B और C के द्वारा जनवरी, फरवरी, मार्च और अप्रैल, 2016 के दौरान कार के एक खास ब्रांड की (100 के गुणक में) बिक्री को दर्शाता है| What was the average number of cars sold by A during Feb-Apr, 2016? फरवरी-अप्रैल 2016 के दौरान, A के दवारा बेची गई कारों की औसत संख्या क्या थी?

MOTHERS-DATA INTERPRETATION-MULTIPLE CHOICE QUESTIONS
  1. The average marks of 39 students of a class is 50. The marks obtained ...

    Text Solution

    |

  2. The full marks for a paper is 300. The breakup of the marks into theor...

    Text Solution

    |

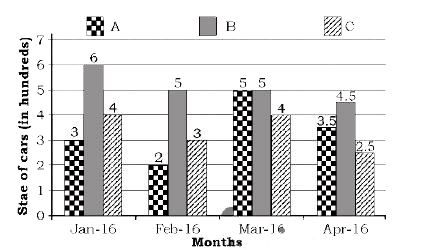
  3. The given bar graph presents the sales of a particular brand of car by...

    Text Solution

    |

  4. The given bar graph presents the sale of a particular brand of car by ...

    Text Solution

    |

  5. What was the average number of cars sold by A during Feb-Apr 2016

    Text Solution

    |

  6. IF the cars sold by A and B are all found to be in perfect order, but ...

    Text Solution

    |

  7. The given bar graph presents the percentages of population in the age ...

    Text Solution

    |

  8. What is the total number of person in the age group of 20 to 50 years ...

    Text Solution

    |

  9. The difference between the number of persons of ages below 20 years in...

    Text Solution

    |

  10. What is the ratio of total number of persons of ages above 50 years in...

    Text Solution

    |

  11. The bar graph shows the exports of Cars of Type A and B In which ...

    Text Solution

    |

  12. What is the ratio of the total exports of cars of type A in 2014 and 2...

    Text Solution

    |

  13. The bar graph shows the exports of Cars of Type A and B The total...

    Text Solution

    |

  14. The given pie chart shows the breakup of total number of the employees...

    Text Solution

    |

  15. The given pie chart shows the breakup of total number of the employees...

    Text Solution

    |

  16. The given pie chart shows the breakup of total number of the employees...

    Text Solution

    |

  17. Study the graph and answer the question that follows What is the...

    Text Solution

    |

  18. The given pie chart shows the quantity wise sales distribution of five...

    Text Solution

    |

  19. The given pie chart shows the quantity wise sales distribution of five...

    Text Solution

    |

  20. The given pie chart shows the quantity wise sales distribution of five...

    Text Solution

    |