Home
Class 14
MATHS
The given graph shows the marks obtained...

The given graph shows the marks obtained by students in an examination

The number of students who obtained less than 300 marks is what percent more than the number of students who obtained 350 or more marks

A

0.8

B

0.28

C

0.444

D

0.227

Text Solution

Verified by Experts

The correct Answer is:
A
Promotional Banner

Topper's Solved these Questions

  • COMPOUND INTEREST

    MOTHERS|Exercise CLASS ROOM EXERCISES |180 Videos
  • GEOMETRY

    MOTHERS|Exercise MULTIPLE CHOICE QUESTIONS |413 Videos

Similar Questions

Explore conceptually related problems

The given graph shows the weights of students in a school on a particular day. The number of students weighing less than 50kg is what percent less than the number of students weighing 55kg or more?

The given graph shows the marks obtained by students in an examination. दिया गया आरेख किसी परीक्षा में छात्रों के प्राप्तांक दर्शाता है | The number of students who obtained less than 300 marks is what percent more than the number of students who obtained 350 or more marks? 300 अंक से कम प्राप्त करने वाले छात्रों की संख्या 350 या इससे अधिक अंक प्राप्त करने वाले छात्रों की संख्या से कितना प्रतिशत अधिक है ?

Study the given histogram that shows the marks obtained by students in examination and answer the question that follows The number of students who obtained less than 200 marks is :

Study the given histogram that shows the marks obtained by students in an examination and answer the question that follows . The number of students who obtained less than 250 marks is :

Study the given graph and answer the question that follows The total marks of students obtaining less than 50 marks is what percentage more than the total number of students obtaining 60 marks or more

The following table shows the marks of 90 students in a test of 80 marks : The percentage of students who have obtained less than or equal to 50% marks is

Study the given graph and answer the question that follows . The number of students who obtained 20 marks or more but less than 60 marks is :

MOTHERS-DATA INTERPRETATION-MULTIPLE CHOICE QUESTIONS
  1. The total imports of steel in 2014, 2016 and 2017 is what percent less...

    Text Solution

    |

  2. In how many years were the imports more than 80% of the average export...

    Text Solution

    |

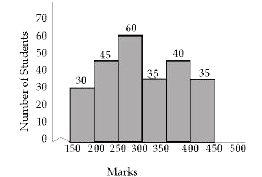
  3. The given graph shows the marks obtained by students in an examination...

    Text Solution

    |

  4. The given graph shows the weights of students in a school on a particu...

    Text Solution

    |

  5. Study the following bar graph and answer the question given The r...

    Text Solution

    |

  6. The total production of motorcycles of companies B and D taken togethe...

    Text Solution

    |

  7. Study the following bar graph and answer the question given निम्नलिख...

    Text Solution

    |

  8. The given pie chart shows the break up of total marks obtaind by a stu...

    Text Solution

    |

  9. The total marks obtained by the student in subjects C and E is approxi...

    Text Solution

    |

  10. What is the difference between the marks obtained by the students in s...

    Text Solution

    |

  11. In the given pie chart what is the total expenditure (in percent) on l...

    Text Solution

    |

  12. In the given bar graph in which college the difference between the per...

    Text Solution

    |

  13. In the given histogram, what is the mean height of all students to one...

    Text Solution

    |

  14. In the given bar graph what is the average number of girls in all coll...

    Text Solution

    |

  15. In the given histogram what percentage of students have height in the ...

    Text Solution

    |

  16. In the given pie chart the expenditure on steel is what percent of the...

    Text Solution

    |

  17. In the given bar graph, what is the ratio of the total boys and girls ...

    Text Solution

    |

  18. In the given histogram, in which class notes the median height of the ...

    Text Solution

    |

  19. In the given pie chart what is the ratio of the total expenditure on s...

    Text Solution

    |

  20. In th given histogram, the number of students whose height is the clas...

    Text Solution

    |