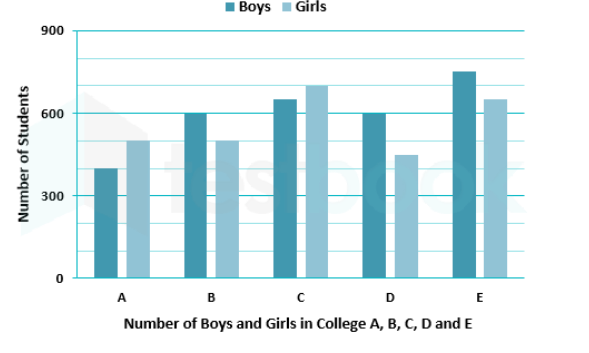
A
B
C
D
Text Solution
Verified by Experts
The correct Answer is:


Topper's Solved these Questions
Similar Questions
Explore conceptually related problems
MOTHERS-DATA INTERPRETATION-MULTIPLE CHOICE QUESTIONS
- What is the difference between the marks obtained by the students in s...
Text Solution
|
- In the given pie chart what is the total expenditure (in percent) on l...
Text Solution
|
- In the given bar graph in which college the difference between the per...
Text Solution
|
- In the given histogram, what is the mean height of all students to one...
Text Solution
|
- In the given bar graph what is the average number of girls in all coll...
Text Solution
|
- In the given histogram what percentage of students have height in the ...
Text Solution
|
- In the given pie chart the expenditure on steel is what percent of the...
Text Solution
|
- In the given bar graph, what is the ratio of the total boys and girls ...
Text Solution
|
- In the given histogram, in which class notes the median height of the ...
Text Solution
|
- In the given pie chart what is the ratio of the total expenditure on s...
Text Solution
|
- In th given histogram, the number of students whose height is the clas...
Text Solution
|
- In the given histogram, which class is the median classs?
Text Solution
|
- In the given bar graph, the percentage decrease in the number of stude...
Text Solution
|
- In the given histogram what is the percentage of students whose height...
Text Solution
|
- In the given bar graph, what is the ratio of students of A and B in t...
Text Solution
|
- In the given pie chart the number of persons using a car is what perce...
Text Solution
|
- In the given bar graph, the number of students enrolled in institute b...
Text Solution
|
- In the given pie chart what is the ratio of the total number of person...
Text Solution
|
- In the given pie chart how many persons are using train to reach their...
Text Solution
|
- In the given pie chart, the amount spend on education is what percent ...
Text Solution
|