


MOTHERS-DATA INTERPRETATION-MULTIPLE CHOICE QUESTIONS
- In th given histogram, the number of students whose height is the clas...
Text Solution
|
- In the given histogram, which class is the median classs?
Text Solution
|
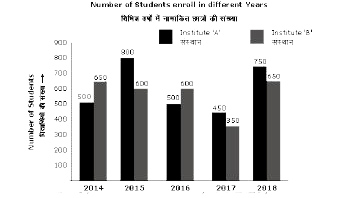
- In the given bar graph, the percentage decrease in the number of stude...
Text Solution
|
- In the given histogram what is the percentage of students whose height...
Text Solution
|
- In the given bar graph, what is the ratio of students of A and B in t...
Text Solution
|
- In the given pie chart the number of persons using a car is what perce...
Text Solution
|
- In the given bar graph, the number of students enrolled in institute b...
Text Solution
|
- In the given pie chart what is the ratio of the total number of person...
Text Solution
|
- In the given pie chart how many persons are using train to reach their...
Text Solution
|
- In the given pie chart, the amount spend on education is what percent ...
Text Solution
|
- In the given bar graph, what is the average number of females in all f...
Text Solution
|
- In the given bar graph, what is the ratio of the total males and femal...
Text Solution
|
- In the given histogram, what percentage of students got marks less tha...
Text Solution
|
- In the given pie chart total expenditure together on rent and educatio...
Text Solution
|
- In the given histogram , in which class interval the median marks lies...
Text Solution
|
- In the given bar graph, in which organisation, the percentage differen...
Text Solution
|
- In the given histogram, what is the mean marks of the students. correc...
Text Solution
|
- In the given pie chart what is the total expenditure on rent
Text Solution
|
- In the given bar graph, in which college the percentage of boys is the...
Text Solution
|
- In the given histogram, what is the mean speed of cars to nearest whol...
Text Solution
|