A
B
C
D
Text Solution
Verified by Experts
The correct Answer is:


Topper's Solved these Questions
Similar Questions
Explore conceptually related problems
MOTHERS-DATA INTERPRETATION-MULTIPLE CHOICE QUESTIONS
- In the given bar graph, in which organisation, the percentage differen...
Text Solution
|
- In the given histogram, what is the mean marks of the students. correc...
Text Solution
|
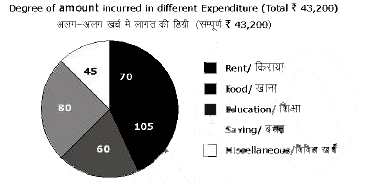
- In the given pie chart what is the total expenditure on rent
Text Solution
|
- In the given bar graph, in which college the percentage of boys is the...
Text Solution
|
- In the given histogram, what is the mean speed of cars to nearest whol...
Text Solution
|
- In the given bar graph what is the ratio of the total boys and girls i...
Text Solution
|
- In the given pie chart if the total employees are 450 and female emplo...
Text Solution
|
- In the given bar graph, what is the average number of girls from all s...
Text Solution
|
- In the given pie-chart. what is the number of employees working in dep...
Text Solution
|
- In the given pie chart what is the central angle of the sector represe...
Text Solution
|
- In the given histogram what percentage of cars were running with the s...
Text Solution
|
- In the given histogram, in which class interval the median lies
Text Solution
|
- The given bar chart shows the details of cycle sales by a company betw...
Text Solution
|
- In the given bar chart, which month sale shows the maximum increase in...
Text Solution
|
- The given pie chart depicts the percentage of students coming to schoo...
Text Solution
|
- The given pie-chart depicts the percentage of students coming to schoo...
Text Solution
|
- The line graph shows electricity consumption for three households A, B...
Text Solution
|
- The line graph shows electricity consumption for three households A, B...
Text Solution
|
- The given pie chart depicts the percentage of students coming to schoo...
Text Solution
|
- The line graph shows electricity consumption for three households A,B ...
Text Solution
|