Home
Class 14
MATHS
The given pie chart shows the taxable in...

The given pie chart shows the taxable income for A B C and D in lakhs of rupees.

This chart shows the tax paid for the above taxable income by A , B C and D in lakhs of rupees

In the given pie chart if B taxable was 12% more how much tax would he have paid then

A

A. 10.8

B

B. 1.008

C

C. 0.9

D

D. 0.108

Text Solution

Verified by Experts

The correct Answer is:
B
Promotional Banner

Topper's Solved these Questions

  • COMPOUND INTEREST

    MOTHERS|Exercise CLASS ROOM EXERCISES |180 Videos
  • GEOMETRY

    MOTHERS|Exercise MULTIPLE CHOICE QUESTIONS |413 Videos

Similar Questions

Explore conceptually related problems

The given pie chart shows the taxable income for A,B , C and D in lakhs of rupees This chart shows the tax paid for the above taxable income by A, B , C and D in lakhs of rupees In the given pie chart what is overall tax percentage for all four?

The given pie chart shows the taxable income for A , B , C and D in lakhs of rupees This chart shows the tax paid for the above taxable income by A, B , C and D in lakhs of rupees IN the given pie chart what is the percentage of tax charged of A

The given pie-chart shows the taxable income for A, B, C and D in lakhs of rupees. This chart shows the tax paid for the above taxable income by A, B, C and D in lakhs of rupees. In the given pie-chart, what is the percentage of tax charged for A?

The given pie-chart shows the taxable income for A, B, C and D in lakhs of rupees. This chart shows the tax paid for the above taxable income by A, B, C and D in lakhs of rupees. In the given pie-chart, what is the percentage of tax charged for A?

The given pie-chart shows the taxable income for A, B, C and D in lakhs of rupees. This chart shows the tax paid for the above taxable income by A, B, C and D in lakhs of rupees. In the given pie-chart. what is the overall tax percentage for all four?

The given pie chart shows the runs scored by 5 players in a match. The runs scored by Kohli are how much percent more than the runs scored by Sharma ?

The given bar chart shows production of steel by companies A , B , C and D for years 2014 ,2015, 2016 In the given pie chart, the average production of steel at C for the year 2014-2016 is:

The given pie chart shows runs scored by A in 6 matches In the given pie chart if A scored century in matches 4 and 6, what would have been her average score?

The given pie-chart shows runs scored by A in 6 matches. In the given pie-chart. if A scored a century in matches 4 and 6, What would have been her average score?

Identify A,B,C and D in the given flow chart and slect the correct option.

MOTHERS-DATA INTERPRETATION-MULTIPLE CHOICE QUESTIONS
  1. The given bar chart shows population of 4 different states in 3 years ...

    Text Solution

    |

  2. The given bar chart shows population of 4 different states in 3 years ...

    Text Solution

    |

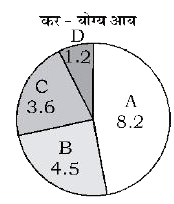
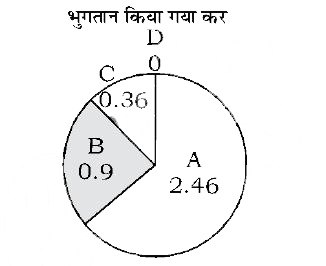
  3. The given pie chart shows the taxable income for A B C and D in lakhs ...

    Text Solution

    |

  4. The line graph shows the temperature on four Sundays of three cities ...

    Text Solution

    |

  5. The line graph shows the temperature on four Sundays of three cities ...

    Text Solution

    |

  6. The line graph shows the temperature on four Sunday of three cities ...

    Text Solution

    |

  7. The given pie chart shows the taxable income for A,B , C and D in lakh...

    Text Solution

    |

  8. The given bar chard shows population of 4 different states in 3 years ...

    Text Solution

    |

  9. The given pie chart shows the taxable income for A , B , C and D in la...

    Text Solution

    |

  10. The given bar chart shows number of marks scored by a student in each ...

    Text Solution

    |

  11. The line graph shows the temperature on four sundays of three cities ...

    Text Solution

    |

  12. The given bar chart shows number of marks scored by a student in each ...

    Text Solution

    |

  13. The line graph shows the temperature on four sundays of three cities ...

    Text Solution

    |

  14. The given pie chart shows runs scored by A in 6 matches In the gi...

    Text Solution

    |

  15. The given pie chart shows scored by A in 6 matches In the given p...

    Text Solution

    |

  16. The given pie chart shows runs scored by A in 6 matches In the gi...

    Text Solution

    |

  17. The given bar chart shows number of marks scored by a student in each ...

    Text Solution

    |

  18. The line graph shows the temperature on four sundays all three cities ...

    Text Solution

    |

  19. The given pie chart shows favorite shows of student of a school I...

    Text Solution

    |

  20. The given bar chart shows the sales for sets of television of three co...

    Text Solution

    |