Home
Class 14
MATHS
The given pie chart shows favorite sport...

The given pie chart shows favorite sport of students of A school

In the given pie chart if the school strength was 2500 how many liked cricket more than hockey?

A

1075

B

504

C

900

D

750

Text Solution

Verified by Experts

The correct Answer is:
C
Promotional Banner

Topper's Solved these Questions

  • COMPOUND INTEREST

    MOTHERS|Exercise CLASS ROOM EXERCISES |180 Videos
  • GEOMETRY

    MOTHERS|Exercise MULTIPLE CHOICE QUESTIONS |413 Videos

Similar Questions

Explore conceptually related problems

The given pie-chart shows favourite sport of students of a school. In the given pie-chart, if the school strength was 2500, how many liked cricket more than hockey?

The given pie chart shows favorite shows of student of a school In the given pie chart, if there were 1280 students in all, how many liked football

The given pie-chart shows favourite sport of students of a school. In the given pie-chart, if there were 1280 students in all, how many liked football?

The given pie-chart shows favourite sport of students of a school. In the given pie-chart, what is the difference in percentage between liking for football and basketball?

The given pie chart shows favorite shows of student of a school In the given pie chart, what is the difference in percentage between liking for football and basketball

The given pie-chart favourite sport of students of a school. दिया गया पाई चार्ट एक विद्यालय के छात्रों के पसंदीदा खेल को दर्शाता है | In the given pie-chart, if the school strength was 2500, how many liked cricket more than hockey? इस पाई चार्ट के अनुसार, यदि विद्यालय में कुल 2500 छात्र थे , तो कितने छात्र क्रिकेट को हॉकी से ज्यादा पसंद करते थे ?

The given pie chart shows runs scored by A in 6 matches In the given pie chart what is the average runs scored in all matches

The given pie chart shows the games played by 1,500 students of a school.Eastudent plays only one game.Find the ratio of the students who play hockey tothose who play badminton.

The given pie chart shows scored by A in 6 matches In the given pie chart, what is the increase or decrease in score in match 4 as compared to match 2

The given pie-chart shows runs scored by A in 6 matches. In the given pie-chart, what is the increase or decrease in score in match 4 as compared to match 2?

MOTHERS-DATA INTERPRETATION-MULTIPLE CHOICE QUESTIONS
  1. The given bar chart, shows the sales for sets of television of three c...

    Text Solution

    |

  2. The given pie chart shows favorite shows of student of a school I...

    Text Solution

    |

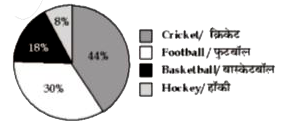
  3. The given pie chart shows favorite sport of students of A school In...

    Text Solution

    |

  4. The table below shows the admission and transfer in standars 1-3 of a ...

    Text Solution

    |

  5. The given bar chart shows the sales of books from six branches of a pu...

    Text Solution

    |

  6. The given pie chart shows the percentage distribution of the expenditu...

    Text Solution

    |

  7. The line graph shows the production of product A and B during the peri...

    Text Solution

    |

  8. The given pie chart shows the percentage distribution of the expenditu...

    Text Solution

    |

  9. The line graph shows the production of product A and B during the peri...

    Text Solution

    |

  10. The given bar chart shows the sales of books from six branches of a pu...

    Text Solution

    |

  11. The line graph shows the production of product A and B during the peri...

    Text Solution

    |

  12. The given pie chart shows the percentage distribution of the expenditu...

    Text Solution

    |

  13. The given bar chart shows the sales of books from six branches of a pu...

    Text Solution

    |

  14. The given pie chart represents the distribution of the percentage of s...

    Text Solution

    |

  15. The given pie chart represents the distribution of the percentage of s...

    Text Solution

    |

  16. The given histogram represents the frequency distribution of average r...

    Text Solution

    |

  17. The given histogram represents the frequency distribution of average r...

    Text Solution

    |

  18. The following pie chart and table show the percentage distribution of ...

    Text Solution

    |

  19. Out of the bar graphs provided below one shows the amount invested a ...

    Text Solution

    |

  20. The give histogram represents the frequency distribution of average ru...

    Text Solution

    |