


MOTHERS-DATA INTERPRETATION-MULTIPLE CHOICE QUESTIONS
- The given bar chart shows the sales of books from six branches of a pu...
Text Solution
|
- The given pie chart shows the percentage distribution of the expenditu...
Text Solution
|
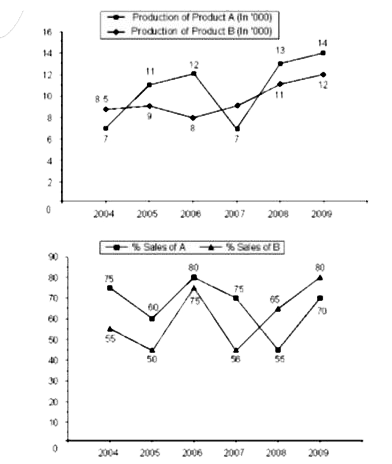
- The line graph shows the production of product A and B during the peri...
Text Solution
|
- The given pie chart shows the percentage distribution of the expenditu...
Text Solution
|
- The line graph shows the production of product A and B during the peri...
Text Solution
|
- The given bar chart shows the sales of books from six branches of a pu...
Text Solution
|
- The line graph shows the production of product A and B during the peri...
Text Solution
|
- The given pie chart shows the percentage distribution of the expenditu...
Text Solution
|
- The given bar chart shows the sales of books from six branches of a pu...
Text Solution
|
- The given pie chart represents the distribution of the percentage of s...
Text Solution
|
- The given pie chart represents the distribution of the percentage of s...
Text Solution
|
- The given histogram represents the frequency distribution of average r...
Text Solution
|
- The given histogram represents the frequency distribution of average r...
Text Solution
|
- The following pie chart and table show the percentage distribution of ...
Text Solution
|
- Out of the bar graphs provided below one shows the amount invested a ...
Text Solution
|
- The give histogram represents the frequency distribution of average ru...
Text Solution
|
- The given bar chart represents the average marks obtained in English E...
Text Solution
|
- The given bar chart presents the average marks obtained in English (E)...
Text Solution
|
- Study the graph and answer the question The number of workers in ...
Text Solution
|
- Study the graph and answer the question Total production of wheat ...
Text Solution
|