Home
Class 14
MATHS
Study the pie chart and answer the quest...

Study the pie chart and answer the question


The number of months in which the number of computers sold was above 20% of the total number of computers sold in 5 months was:

A

3

B

4

C

1

D

2

Text Solution

Verified by Experts

The correct Answer is:
A
Promotional Banner

Topper's Solved these Questions

  • COMPOUND INTEREST

    MOTHERS|Exercise CLASS ROOM EXERCISES |180 Videos
  • GEOMETRY

    MOTHERS|Exercise MULTIPLE CHOICE QUESTIONS |413 Videos

Similar Questions

Explore conceptually related problems

Study the pie chart and answer the question The total number of computers sold in February and April is what percentage more than the number of computers sold in May

Study the graph and answer the question The number of states in which the production of wheat is more than 20% of the total production of rice in all five states is……..

The given table represents the number of computers sold by four dealers A,B, C and D during the first six months of 2016. Study the table carefully and answer the questions that follows: दी गयी तालिका चार विक्रेताओं A, B, C और D के द्वारा 2016 के पहले छः महीनों में बेचे गए कंप्यूटरों की संख्या दर्शाती है | इस तालिका का ध्यानपूर्वक अध्ययन करें तथा पूछे गए प्रश्नों का उत्तर दें | The number of months, in which the number of computers sold by dealer B was less than the average number of computers sold by dealer C over six months, was: / ऐसे कितने महीने हैं, जिनमें विक्रेता B के द्वारा बेचे गए कंप्पूटरों की संख्या इन छः महीनों में विक्रेता C के द्वारा बेचे गए कंप्यूटरों की औसत संख्या से कम है ?

Direction: The given bar graph shows the number of pens sold by two shops A & B in four consecutive months. Study the following data and answer the following questions: Find the ratio of the number of pens sold by shop A in 1st month to the number of pens sold by B in 3rd month.

Study the pie chart and answer the question The total number of employees of the company in offices D and E in what percentage more than the number of employees in office A?

Study the pie chart and answer the question The total number of employees working in production and IT department exceeded the total number of employees working in the marketing and accounts department by

Study the pie chart and answer the question IF 80% of the number of employees working in IT department and 40% of the number of the employees working in both the HR and Accounts departments are females, then total number of female employees working in these three department is

Study the pie-chart and answer the question: If 60% of the number of employees working in the IT department and 50% of the number of employees working in both the HR and Accounts departments are females, then total number of female employees working in these three departments is .........

The pie-chart shows percentage wise distribution of teachers who teach six different subjects. Study the pie chart and answer the question : Total number of teachers =1650 What is the difference between the total number of teachers who teach Physics and Maths and the total number of teachers who tech chemistry and biology ?

MOTHERS-DATA INTERPRETATION-MULTIPLE CHOICE QUESTIONS
  1. Study the given pie chart and answer the question that follows If...

    Text Solution

    |

  2. Study the bar graph and answer the question The number of neon la...

    Text Solution

    |

  3. Study the pie chart and answer the question The number of mon...

    Text Solution

    |

  4. Study the bar graph and answer the question In how many years was...

    Text Solution

    |

  5. Study the bar graph and answer the question Percentage decrease i...

    Text Solution

    |

  6. Study the bar graph and answer the question The total number of t...

    Text Solution

    |

  7. Study the bar graph and answer the question The ratio of the numb...

    Text Solution

    |

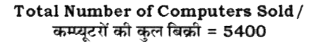
  8. Study the pie chart and answer the question The total number of c...

    Text Solution

    |

  9. Study the bar graph and answer the question The number of neon la...

    Text Solution

    |

  10. Study the given graph and answer that follows IF 162 of the total...

    Text Solution

    |

  11. Study the given graph and answer the question that follows In whi...

    Text Solution

    |

  12. Study the given graph and answer the question that follows the num...

    Text Solution

    |

  13. What is the ratio of the total production of the company B and C toget...

    Text Solution

    |

  14. Study the given pie chart and answer the question that follows If...

    Text Solution

    |

  15. Study the graph carefully and answer the question below The total ...

    Text Solution

    |

  16. Study the given pie chart and answer the question that follows IF...

    Text Solution

    |

  17. Study the given pie chart and answer the question that follows Th...

    Text Solution

    |

  18. Study the given graph and answer the question that follows The to...

    Text Solution

    |

  19. Study the following graph carefully and answer the question IF to...

    Text Solution

    |

  20. The given pie chart shows expenditure on different type of sport in a ...

    Text Solution

    |