A
B
C
D
Text Solution
Verified by Experts
The correct Answer is:


Topper's Solved these Questions
Similar Questions
Explore conceptually related problems
ALLEN-TEST PAPERS-PAPER 3
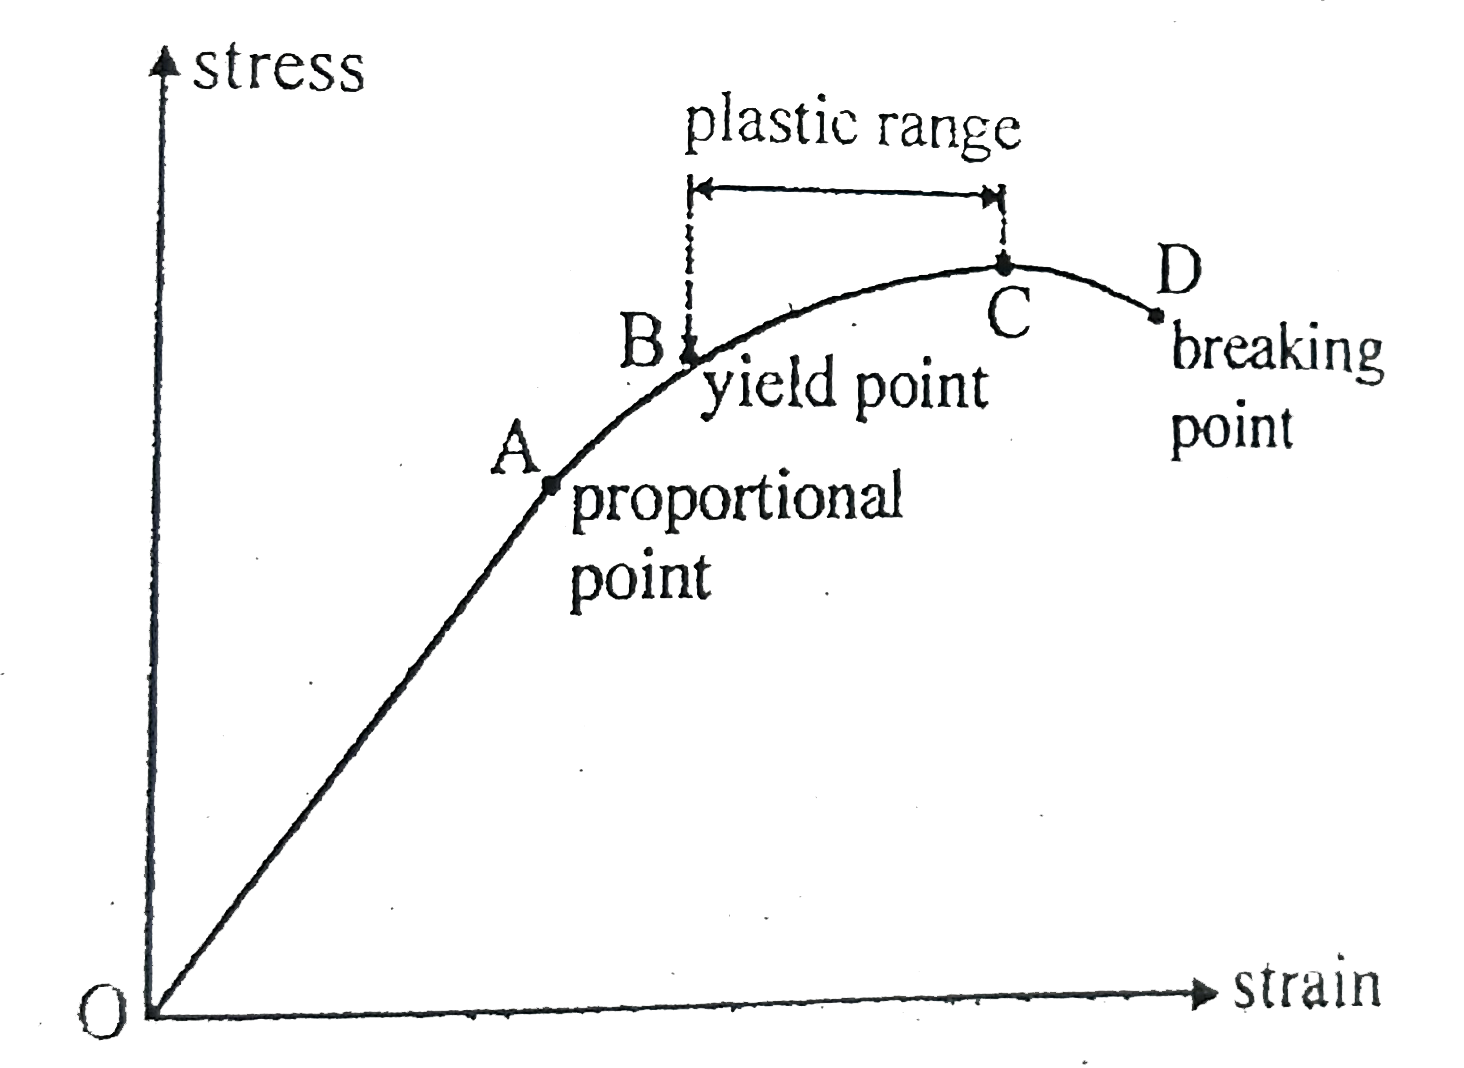
- Figure shows the relationship between tensile stress and strain for a ...
Text Solution
|
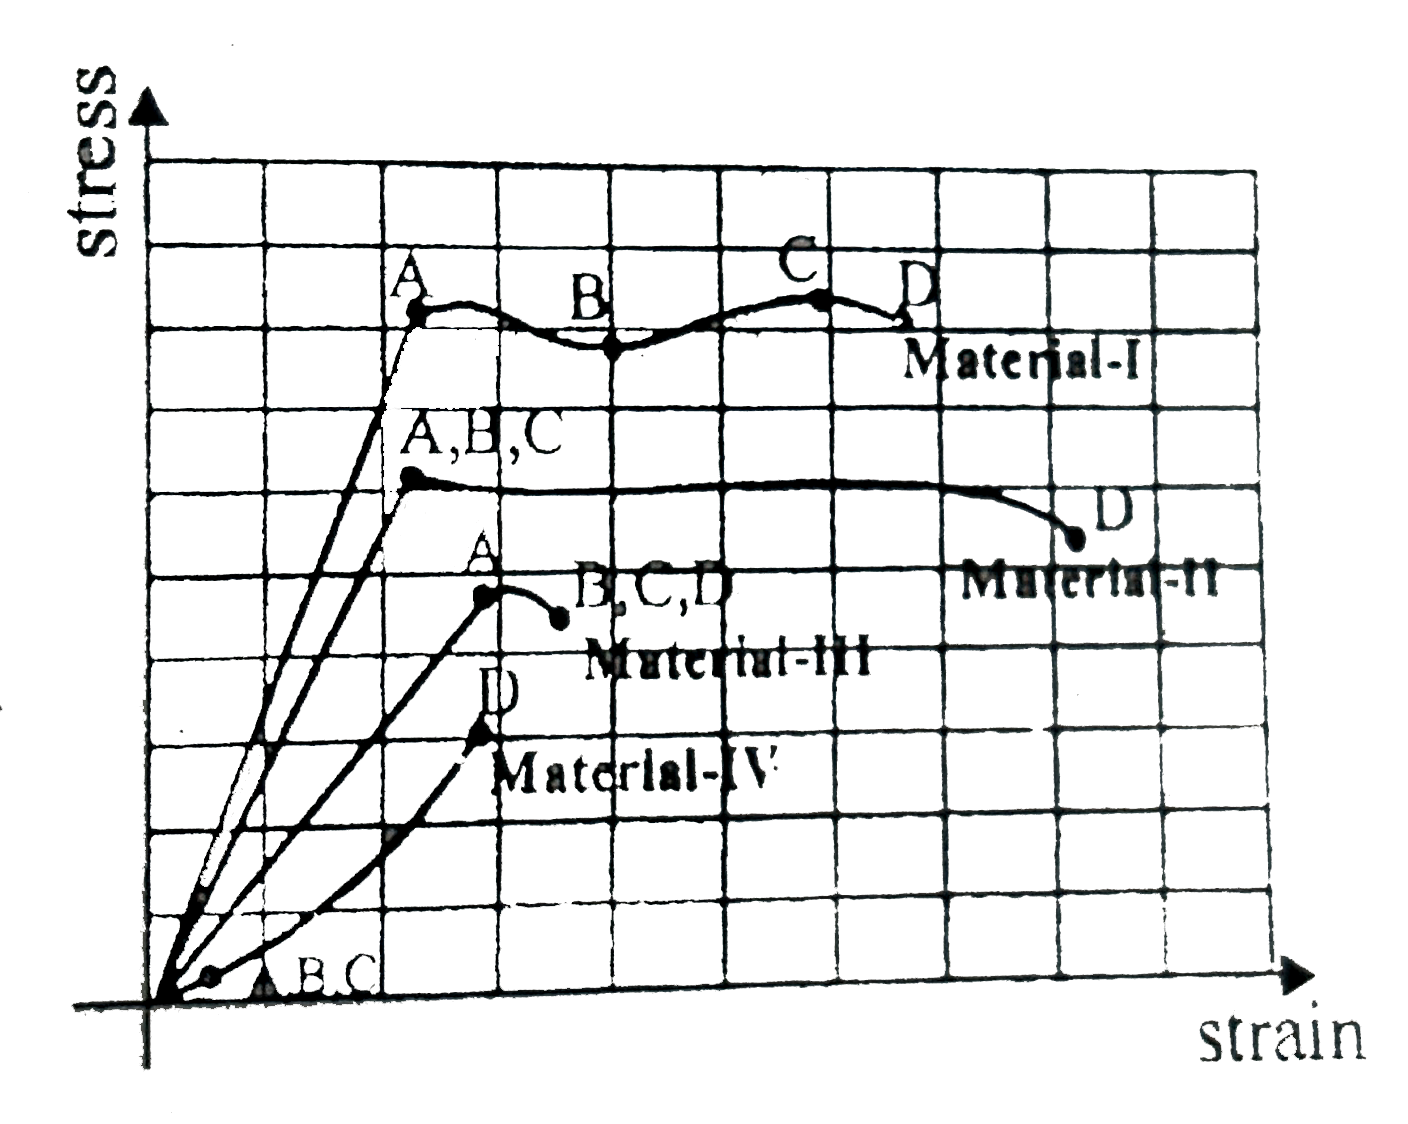
- Figure shows the relationship between tensile stress and strain for a ...
Text Solution
|
- Figure shows the relationship between tensile stress and strain for a ...
Text Solution
|
- A siphon tube discharging a liquid of density 90 kg//m^(3) as shown in...
Text Solution
|
- A siphon tube discharging a liquid of density 90 kg//m^(3) as shown in...
Text Solution
|
- A rope placed straight on a frictionless floor is pulled longitudinall...
Text Solution
|
- A steel ball strikes a fixed smooth steel plate placed on a horizontal...
Text Solution
|
- A ball is thrown vertically upwards. It was observed at a height h twi...
Text Solution
|
- The graph represents the decay of a newly-prepared sample of radioacti...
Text Solution
|
- Four tuning forks of frequencies 200,201,204 and 206 Hz are sounded to...
Text Solution
|
- Electrons used in an electron microscope are accelerated by a voltage ...
Text Solution
|
- A bead is free to slide down a smooth wire tightly stretched between p...
Text Solution
|
- As shown in the figure, initially both th springs are in normal length...
Text Solution
|
- One mole of an ideal gas undergoes a process whose molar heat capacity...
Text Solution
|
- A driver having a definite reaction time is capable of stopping his ca...
Text Solution
|
- n moles of an ideal triatomic linear gas undergoes a process in which ...
Text Solution
|
- A particle with the potentila energy shown in the graph is moving to t...
Text Solution
|
- The logic circuit shown has the input waveforms 'A' and 'B' as shown. ...
Text Solution
|
- If the B-H curves of two samples of P and Q of iron are as shown below...
Text Solution
|
- The conductance of a solution of an electrolyte is equal to that of it...
Text Solution
|