A
B
C
D
Text Solution
Verified by Experts
The correct Answer is:


Topper's Solved these Questions
Similar Questions
Explore conceptually related problems
ALLEN-TEST PAPER-PHYSICS
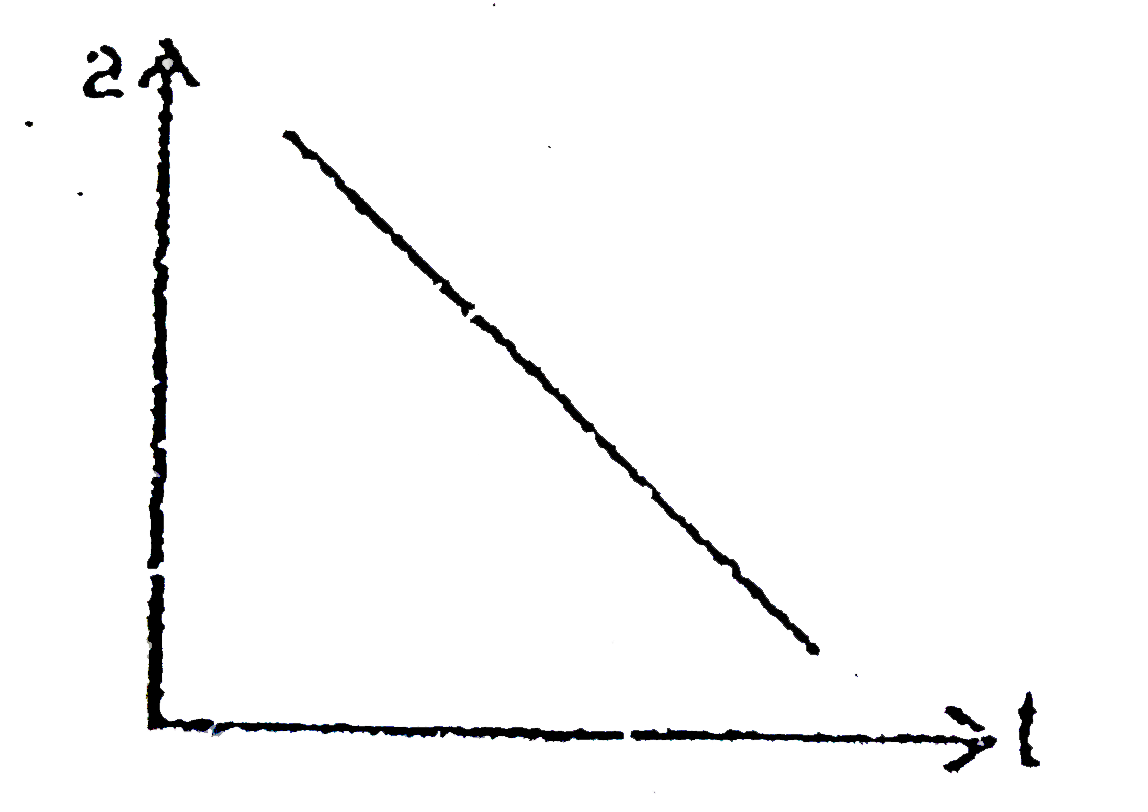
- The acceleration time graph of a body moving in a straight is shown in...
Text Solution
|
- Choose the correct statement:
Text Solution
|
- Initially elongation in spring is 5 cm and blocks are at rest. An exte...
Text Solution
|
- If I1/I2 =25 then find the value of (Imax - Imin)/ (Imax+Imin)
Text Solution
|
- A particle moves in straight line. Acceleration of particle changes wi...
Text Solution
|