Text Solution
Verified by Experts
The correct Answer is:


Topper's Solved these Questions
KINEMATICS
ALLEN|Exercise Assertion-Reason|20 VideosKINEMATICS
ALLEN|Exercise Comprehension#1|3 VideosKINEMATICS
ALLEN|Exercise EXERCISE-02|57 VideosERROR AND MEASUREMENT
ALLEN|Exercise Part-2(Exercise-2)(B)|22 VideosKINEMATICS (MOTION ALONG A STRAIGHT LINE AND MOTION IN A PLANE)
ALLEN|Exercise BEGINNER S BOX-7|8 Videos
Similar Questions
Explore conceptually related problems
ALLEN-KINEMATICS-EXERCISE-03
- The equation of one dimensional motion of the particle is described in...
Text Solution
|
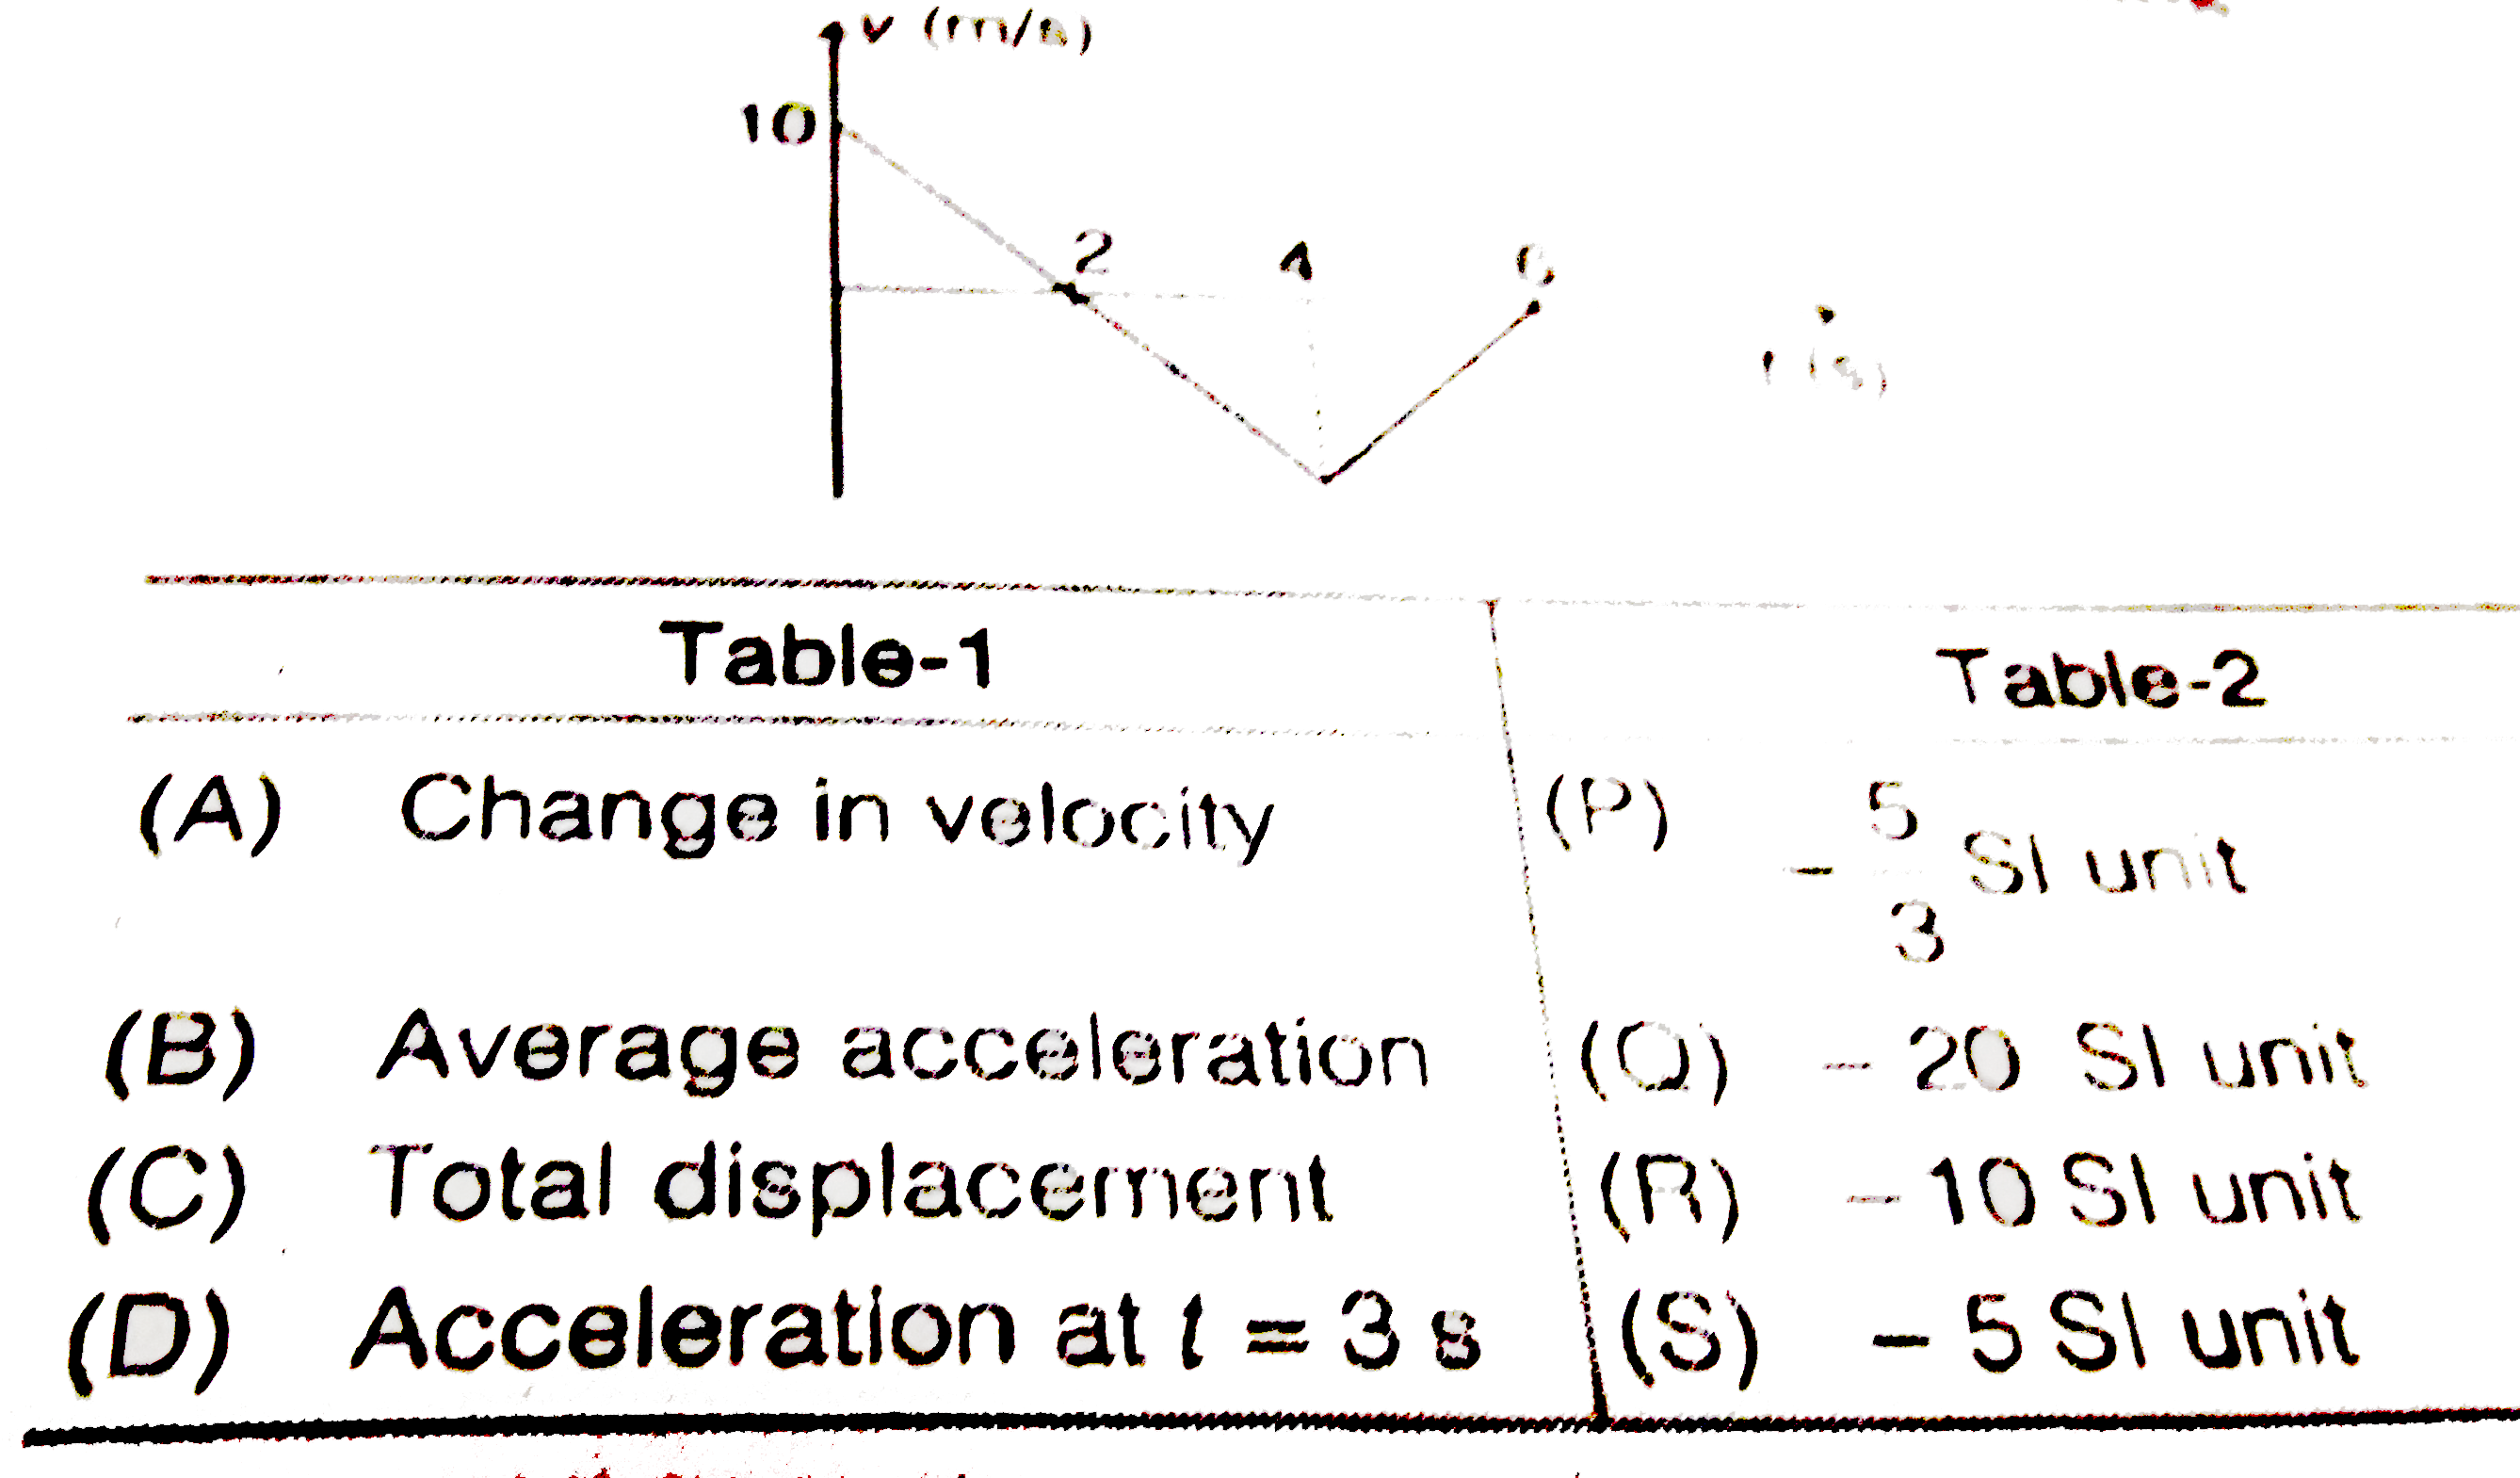
- Match the following
Text Solution
|
- For the velocity time graph shown in figure, in a time interval from t...
Text Solution
|
- A particle is rotating in a cirlce of radius 1 m with constant speed 4...
Text Solution
|
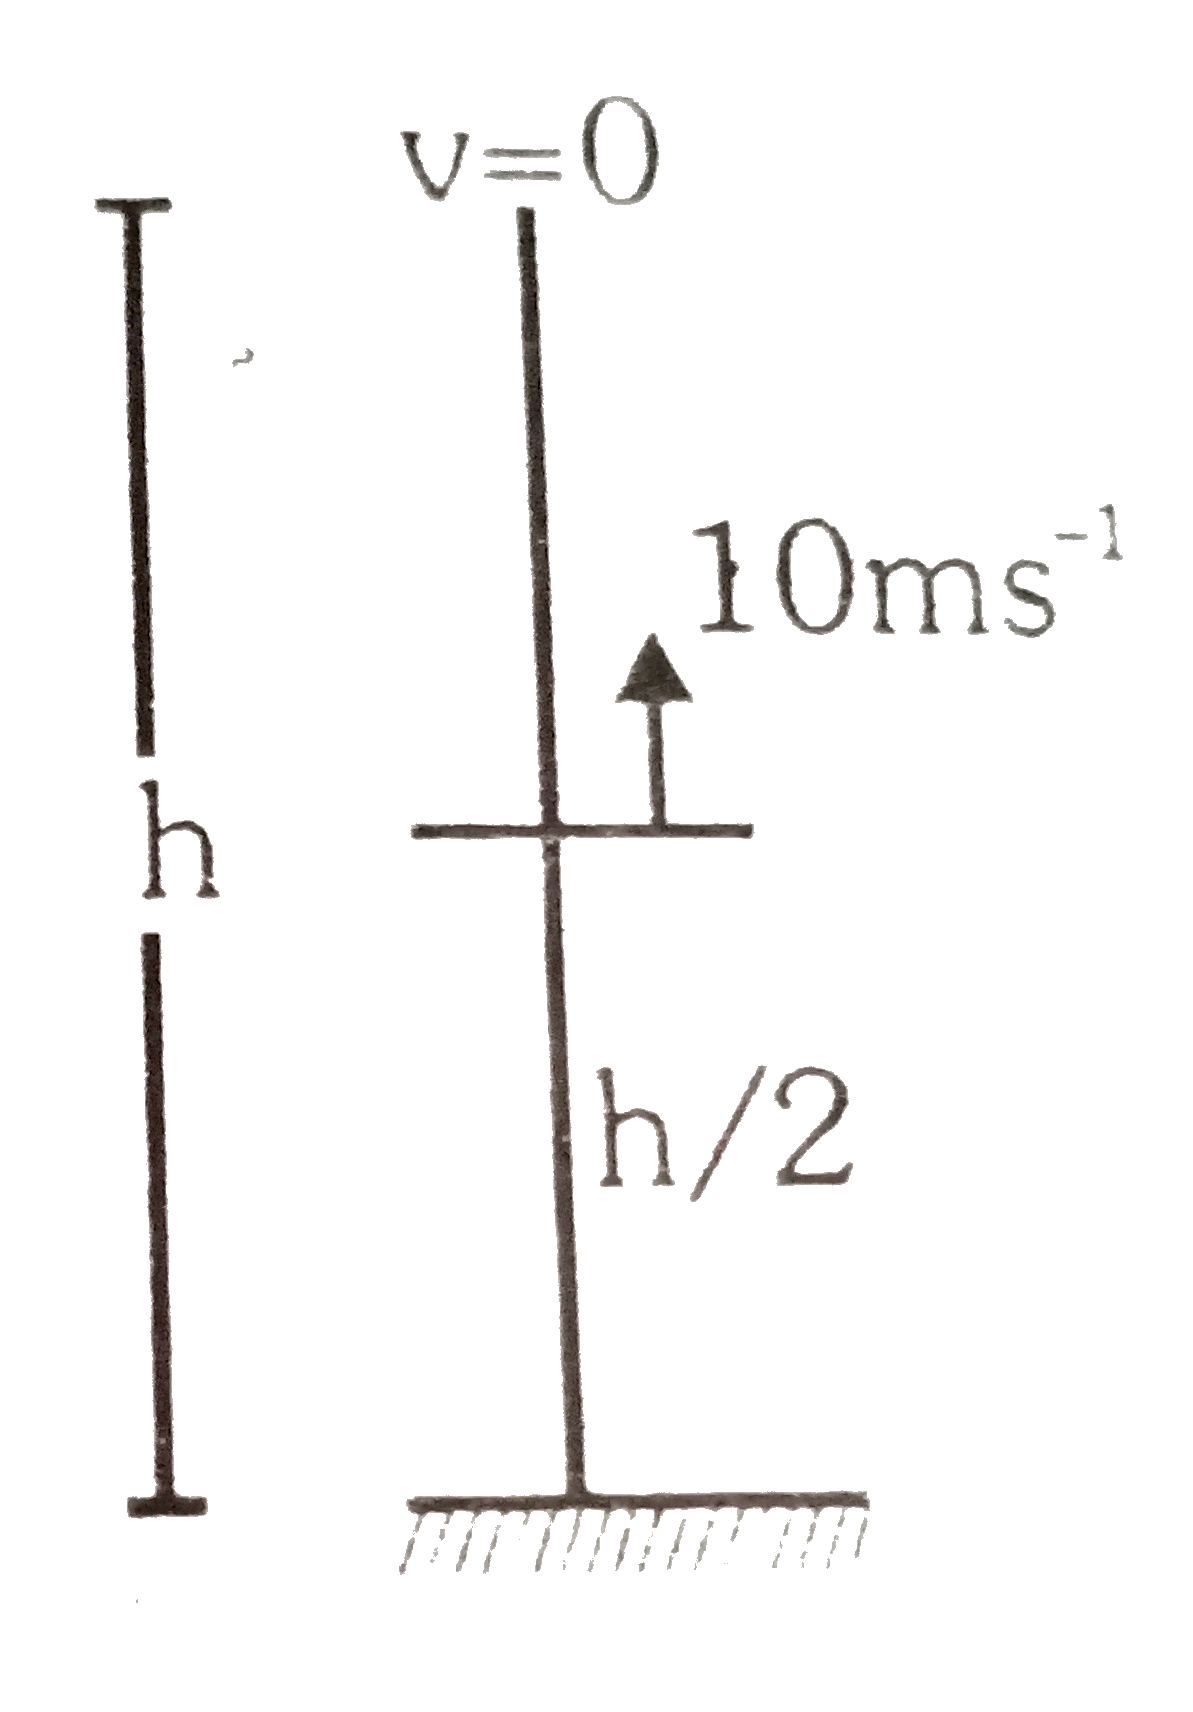
- A balloon rise up with constant net acceleration of 10m//s^(2). After ...
Text Solution
|
- In the figure shown ,acceleration of 1 is x (upwards). Acceleration of...
Text Solution
|