A
B
C
D
Text Solution
Verified by Experts
The correct Answer is:


Topper's Solved these Questions
Similar Questions
Explore conceptually related problems
ALLEN-TEST PAPER-CHEMISTRY SECTION-II
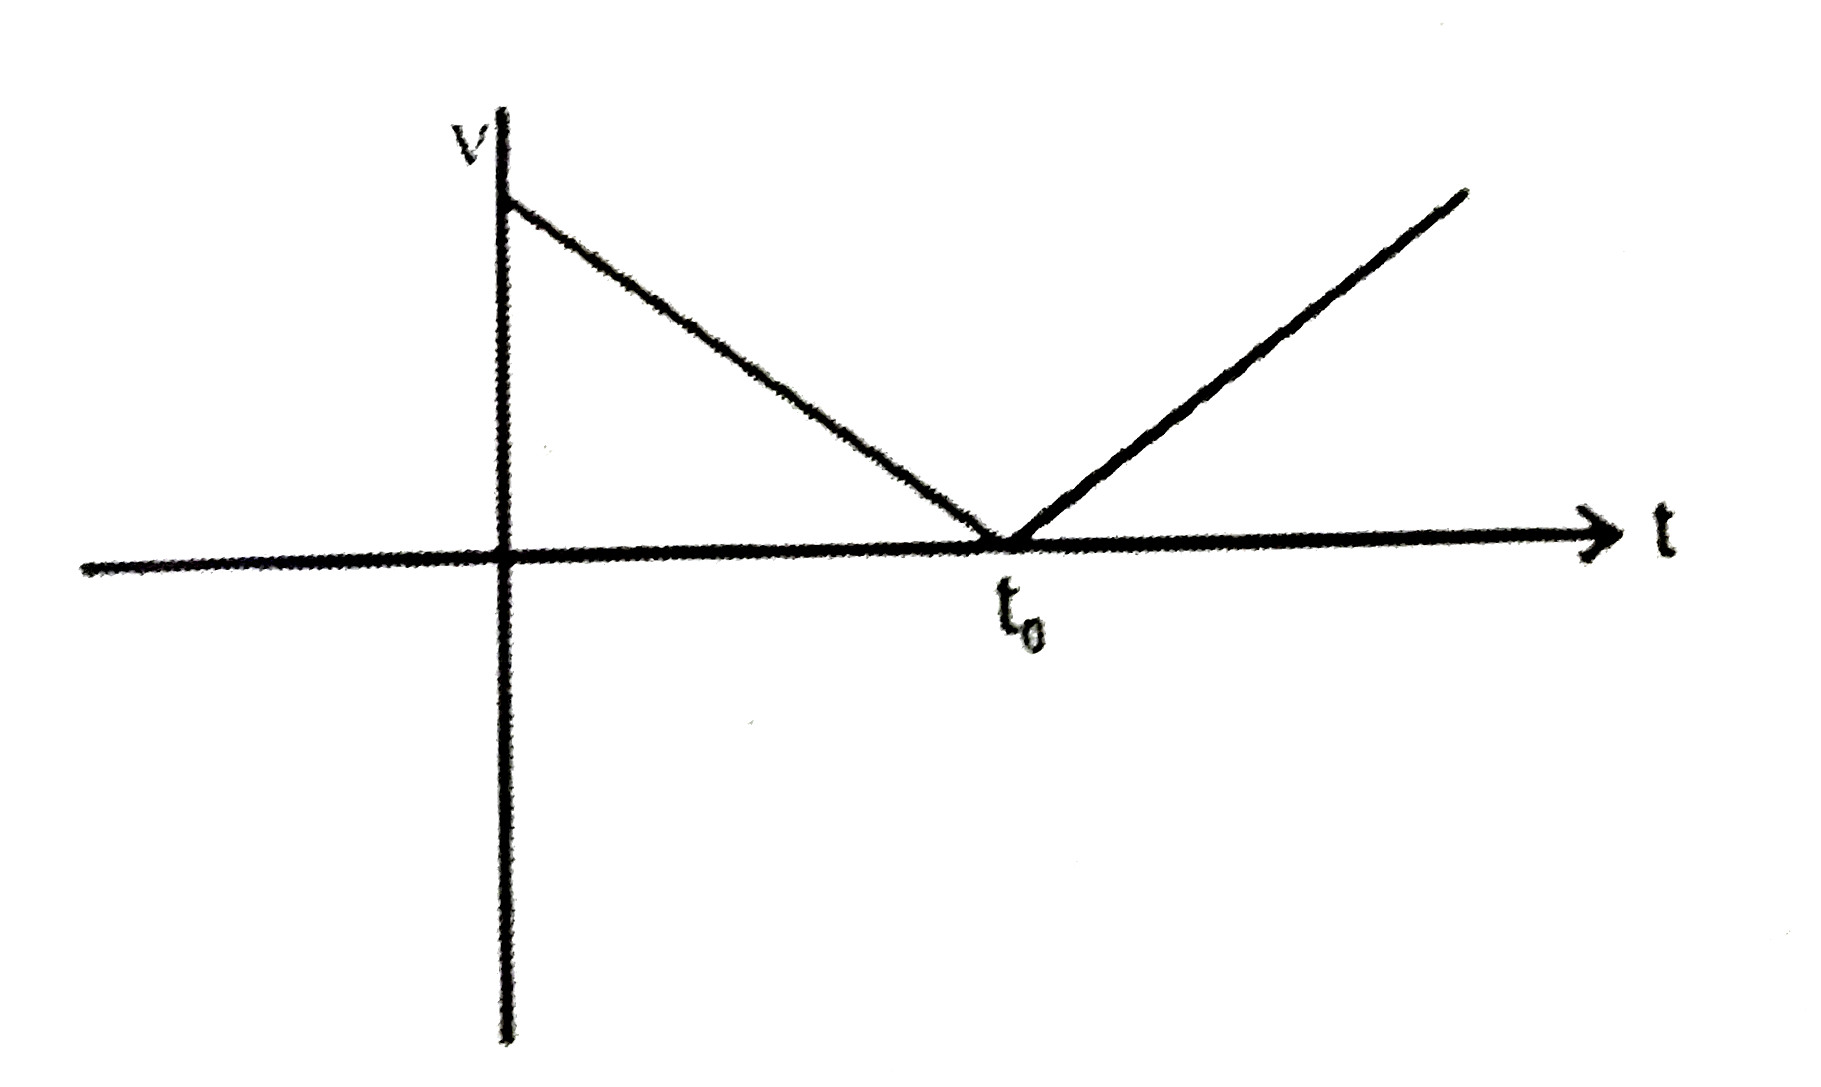
- Velocity time graph of a particle is given below. Particle starts from...
Text Solution
|
- A particle is moving along x-axis. Velocity of particle changes as v=s...
Text Solution
|
- Which of the following set of quantum numbers, an electron will have l...
Text Solution
|
- Which of the following set is pair of isoster species.
Text Solution
|