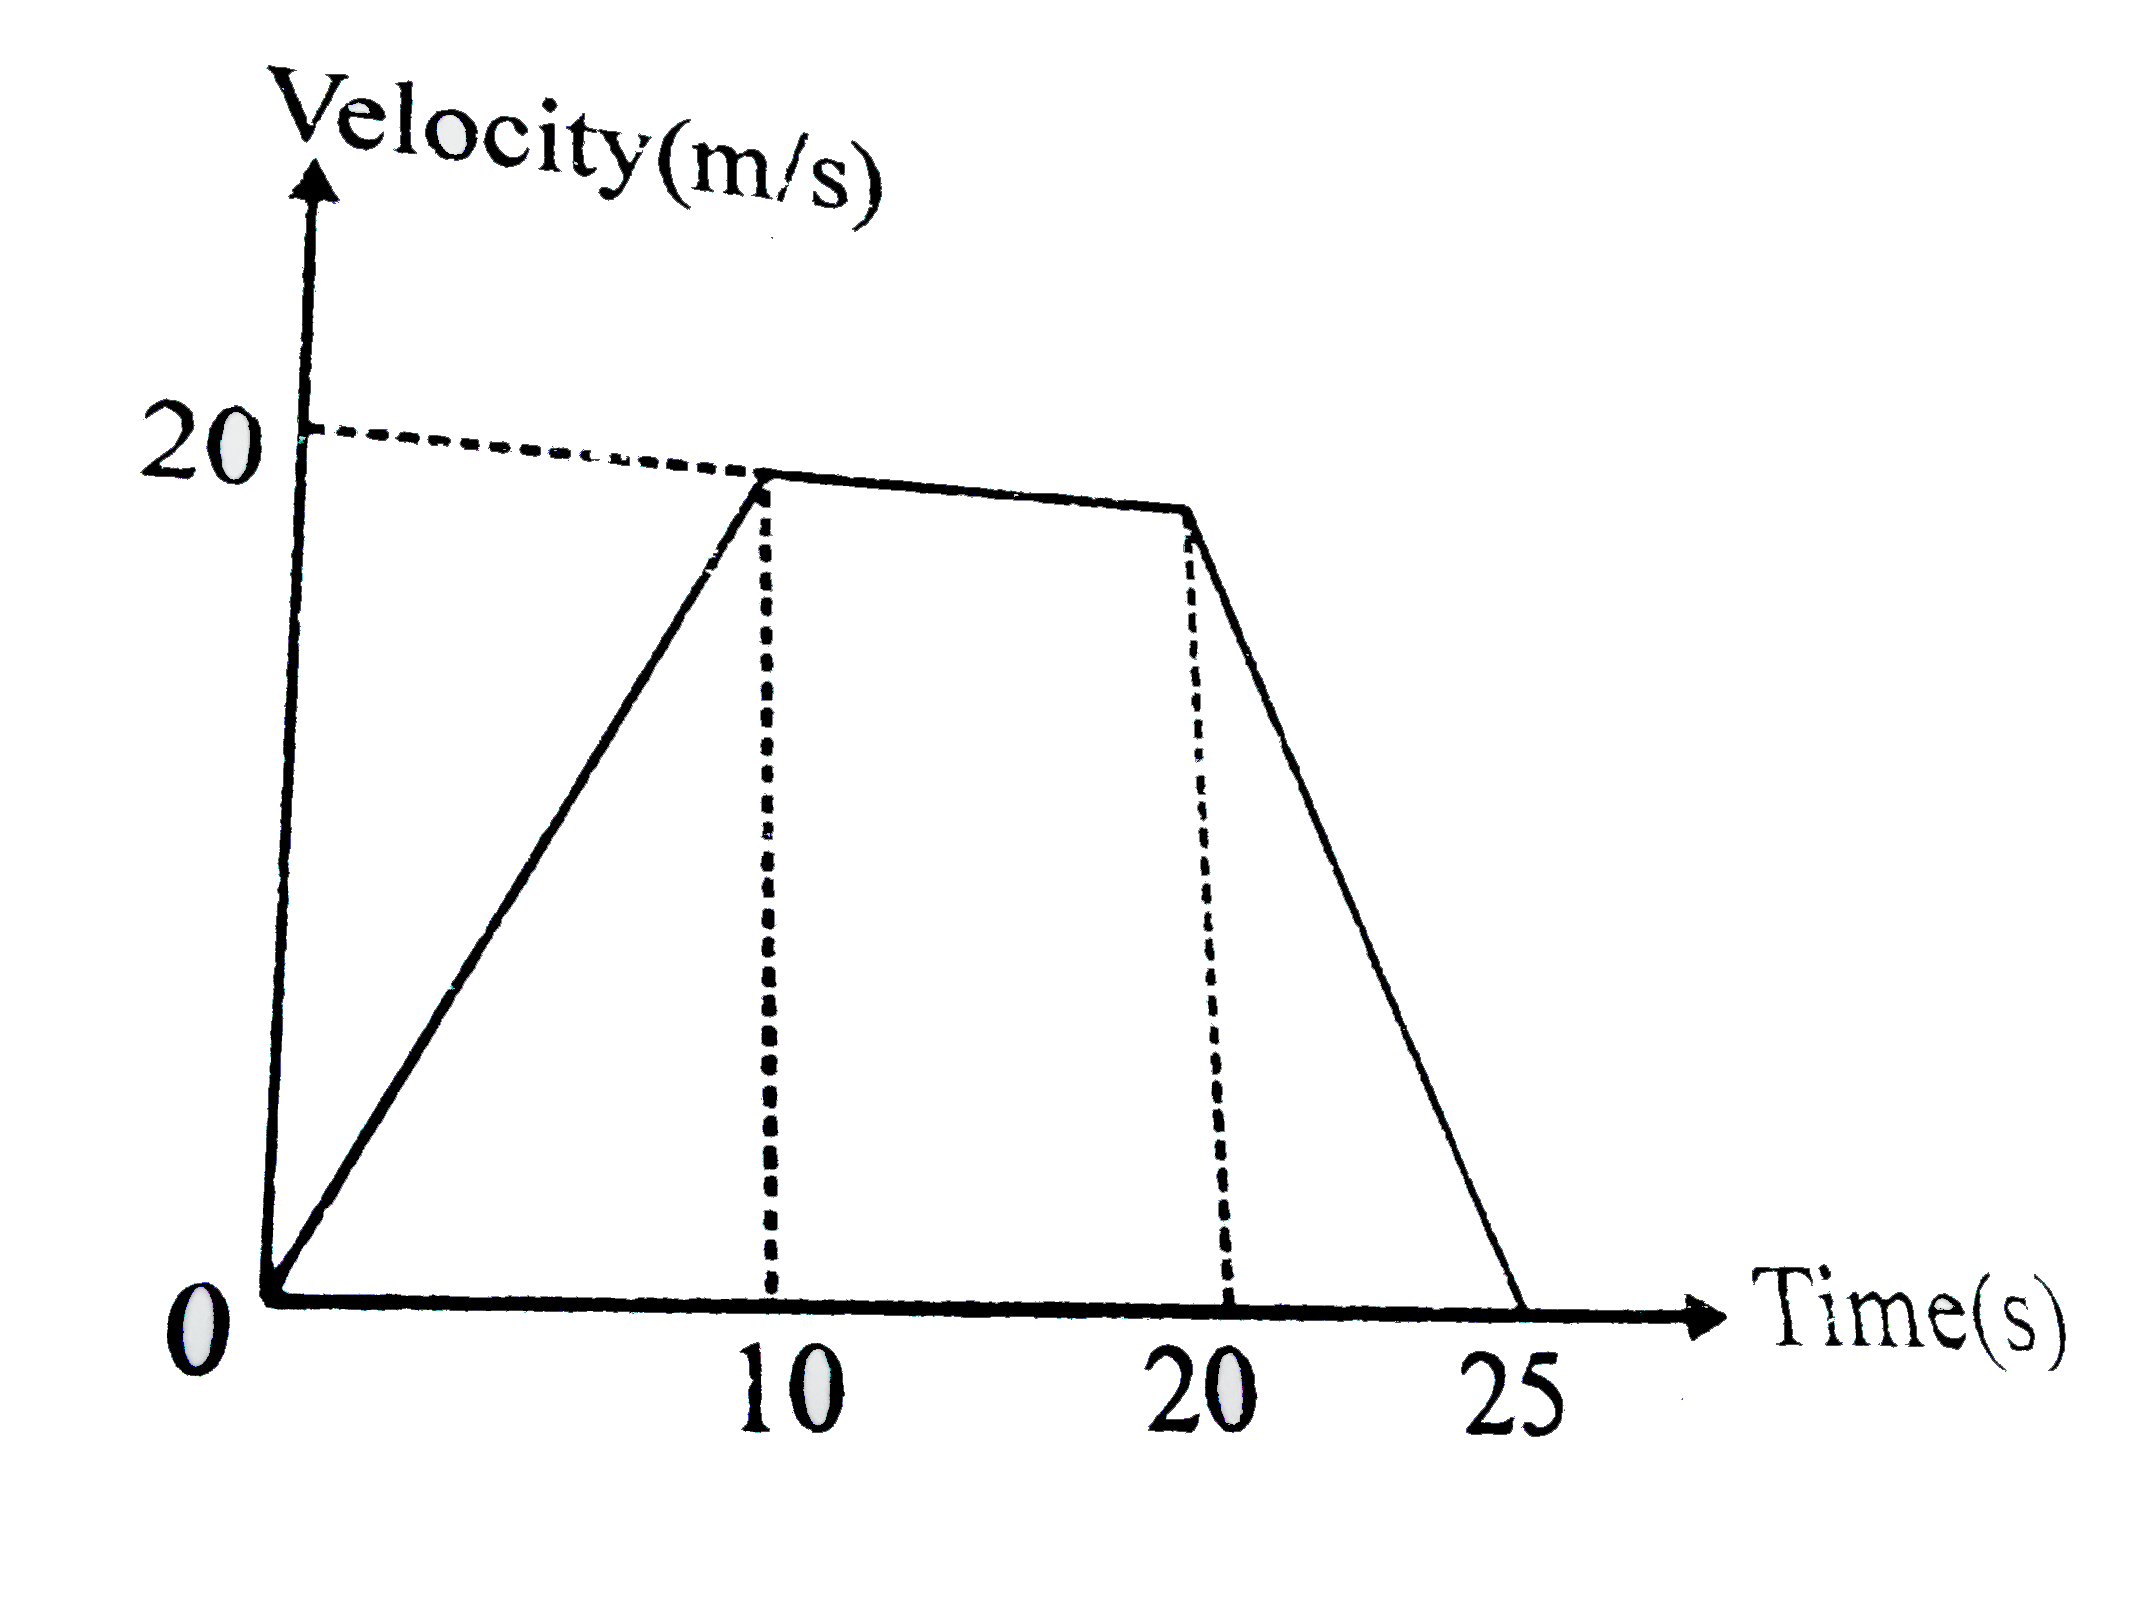
The velocity-time graph of a car moving along a straight road is shown in figure. The average velocity of the car in first 25 seconds is
Topper's Solved these Questions
BASIC MATHS
ALLEN|Exercise Exersice-03|7 Videos
BASIC MATHS
ALLEN|Exercise ASSERTION-REASON|11 Videos
AIIMS 2019
ALLEN|Exercise PHYSICS|40 Videos
CIRCULAR MOTION
ALLEN|Exercise EXERCISE (J-A)|6 Videos
Similar Questions
Explore conceptually related problems
The velocity-time graph of a car moving along a straight road is shown in figure. The average velocity of the car is first 25 seconds is
A car moving on a straight road is an example of:
The velocity time plot for a particle moving on straight line is shown in the figure.
The velocity time plot for a particle moving on straight line is shown in the figure.
The velocity and time graph for a particle moving in a straight line s shown in the figure. Then, the average velocity between t=4 s and t=6 s is _____
The speed - time graph for a body moving along a straight line is shown in figure. The average acceleration of body may be
The velocity (v)-time (t) graph of a partide moving along a straight line is as shown in the figure. The displacement of the particle from t = 0 to t = 4 is
The velocity versus time graph of a body moving in a straight line is as shown in the figure below
The acceleration-time graph of a particle moving in a straight line is as shown in figure. The velocity of the particle at time t = 0 is 2 m//s . The velocity after 2 seconds will be
The acceleration-time graph of a particle moving in a straight line is as shown in figure. The velocity of the particle at time t = 0 is 2 m//s . The velocity after 2 seconds will be