Text Solution
Verified by Experts
The correct Answer is:


Topper's Solved these Questions
Similar Questions
Explore conceptually related problems
ALLEN-MOTION IN A PALNE-EXERCISE-03
- A man traversed half the distance with a velocity v(0). The remaining ...
Text Solution
|
- An elevator is accelerating upward at a rate of 6ft/sec^(2) when a bol...
Text Solution
|
- A stone is thrown vertically upwards. When stone is at a height half o...
Text Solution
|
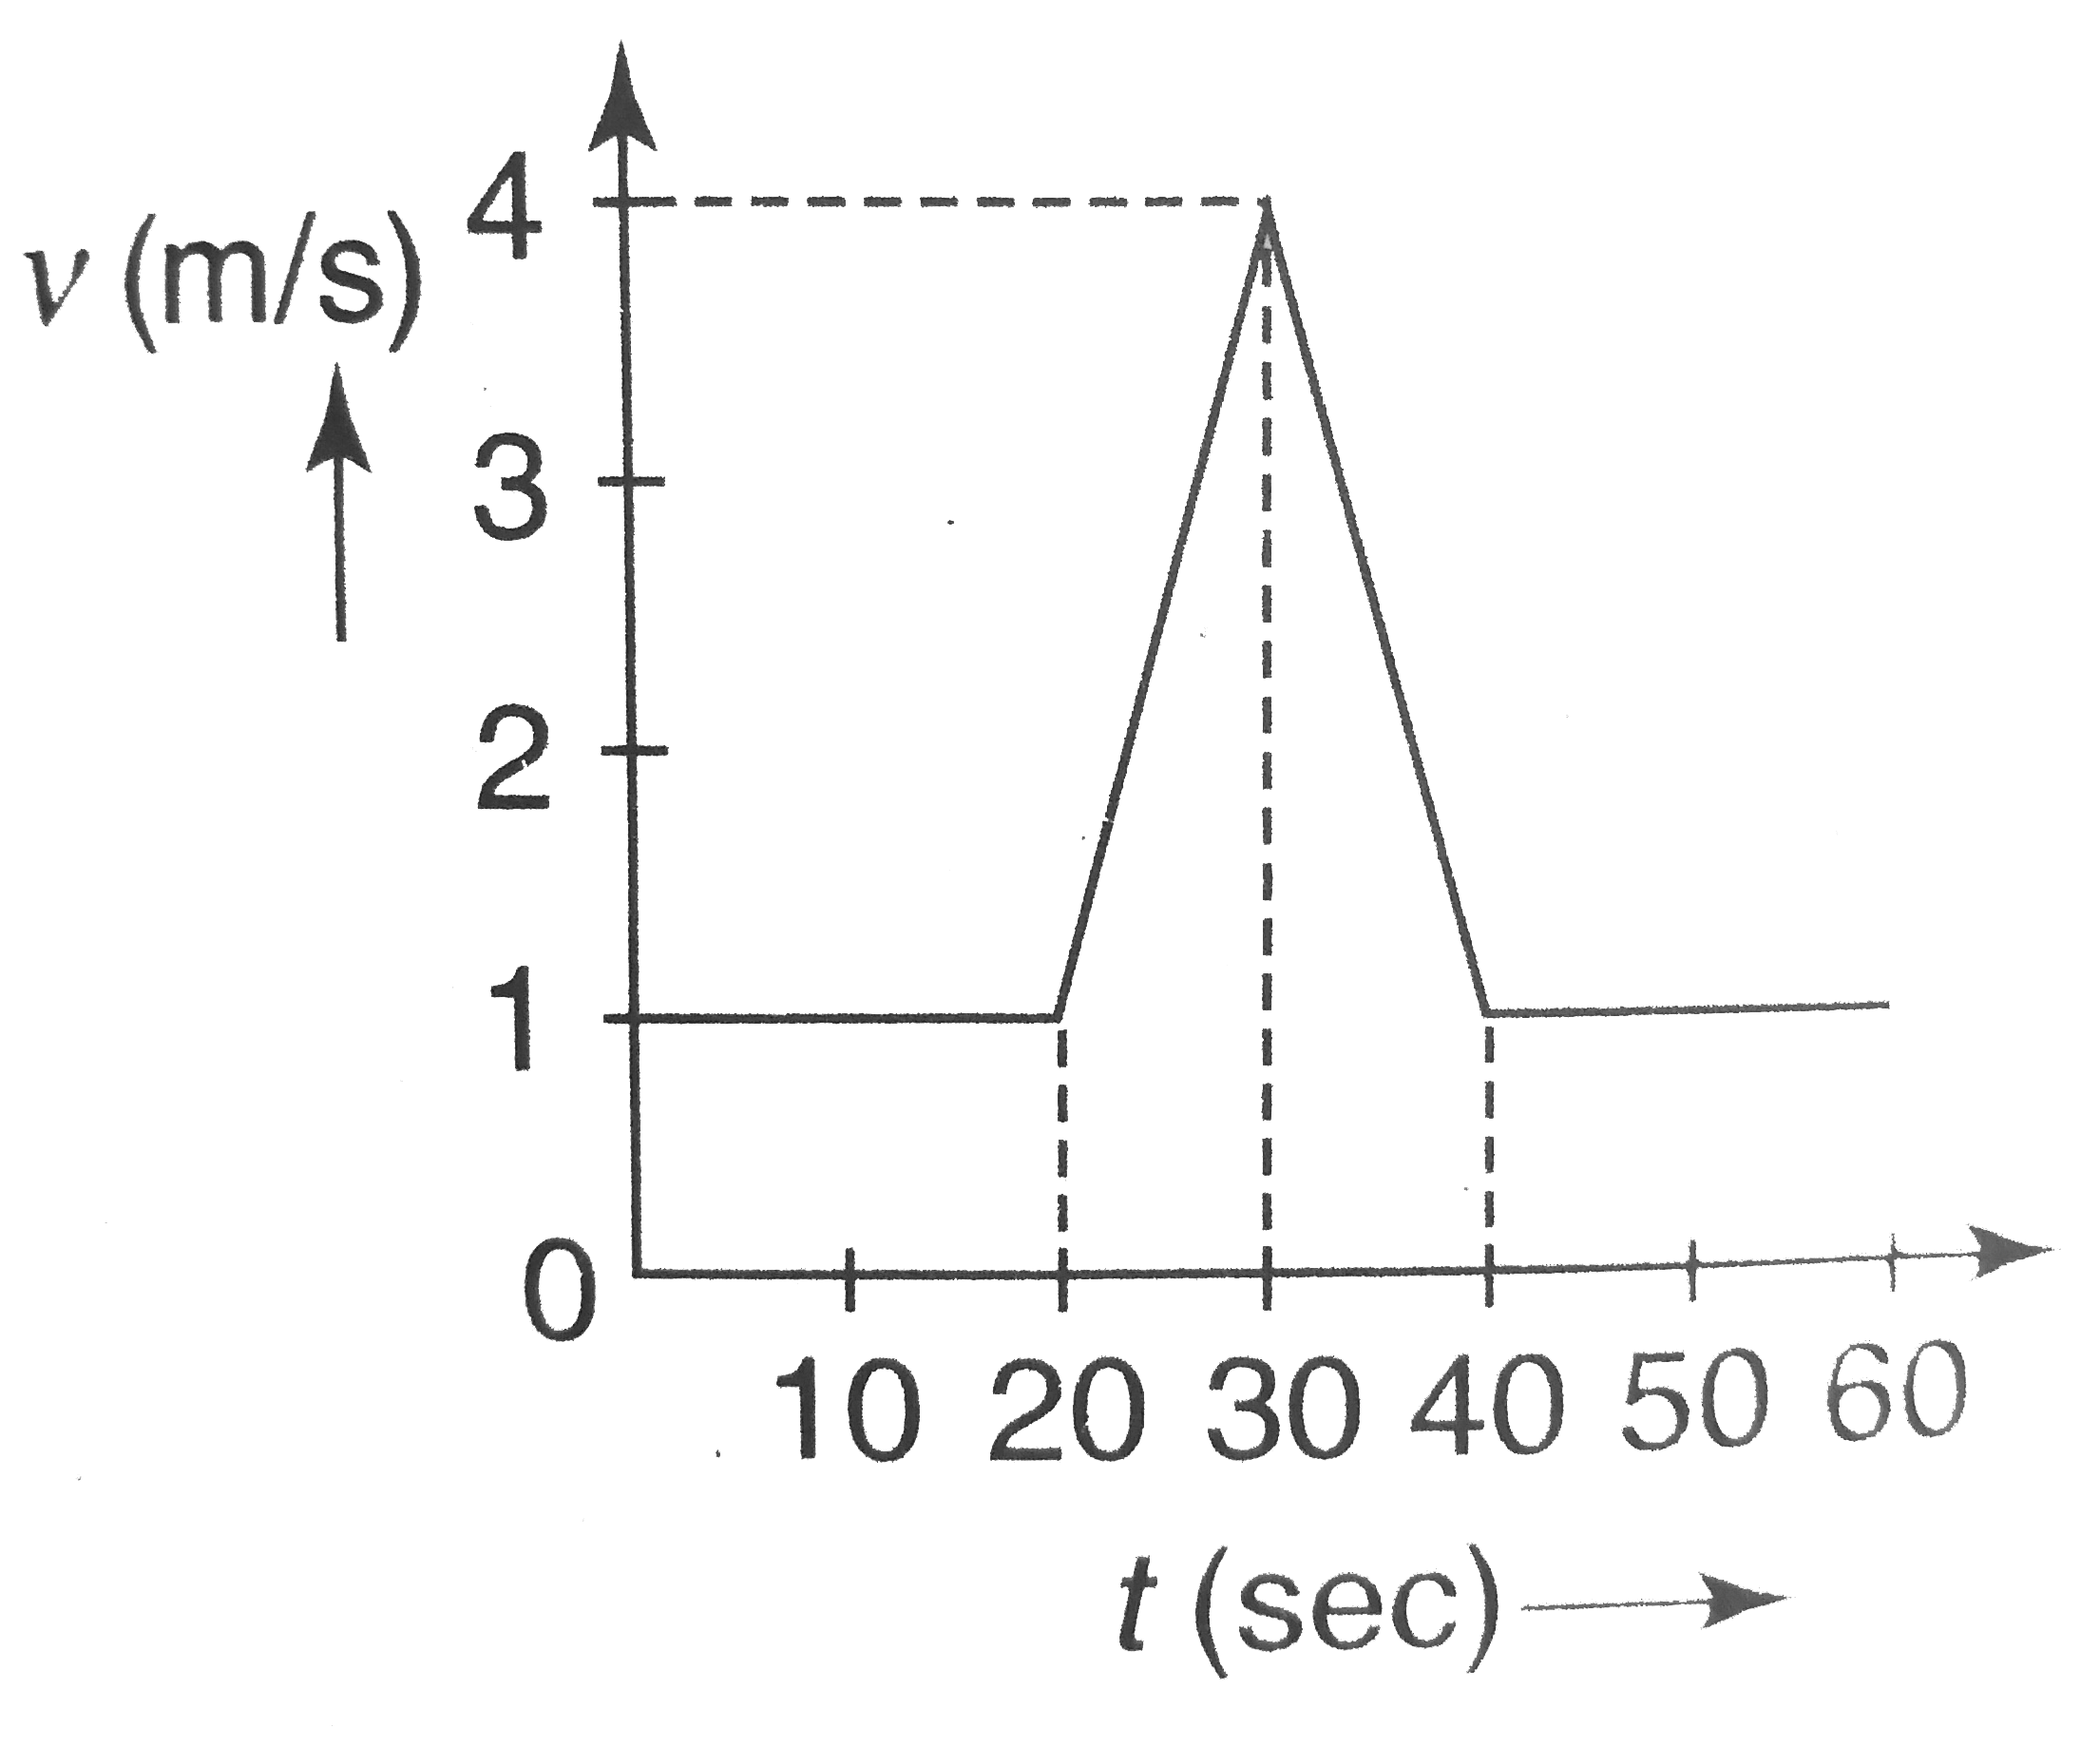
- Velocity-time graph for a moving object is shown in the figure. Total ...
Text Solution
|
- When a ball is thrown up vertically with velocity v(0), it reaches a m...
Text Solution
|
- A car acquires a velocity of 72 km h^(-1) In 10 s starting from rest. ...
Text Solution
|