Home
Class 12
PHYSICS
Assertion : Current versus potential dif...

Assertion : Current versus potential difference (i-V) graph for a conductor at two different temperatures `T_(1)` and `T_(2)` is shown in figure. Hence `T_(1)gt T_(2)`.

Reason : Resistance of a conductor increases with rise in temperature.

Text Solution

Verified by Experts

The correct Answer is:
`((a)/(2),(7a)/(10))`

`x_(cm) = ((m xx 0) + (2m xx a) + (3m xx a) + (4m xx 0))/(m + 2m + 3m + 4m)= (a)/(2)`
`y_(cm) = ((m xx 0) + (2m xx 0)+ (3m xx a) + (4m xx a))/(m + 2m + 3m + 4m) =(7a)/(10)`
Promotional Banner

Topper's Solved these Questions

  • CURRENT ELECTRICITY

    ALLEN|Exercise EXERCISE-IV B|14 Videos
  • CURRENT ELECTRICITY

    ALLEN|Exercise EXERCISE-V A|20 Videos
  • CURRENT ELECTRICITY

    ALLEN|Exercise EXERCISE-III|26 Videos
  • CIRCULAR MOTION

    ALLEN|Exercise EXERCISE (J-A)|6 Videos
  • GEOMETRICAL OPTICS

    ALLEN|Exercise subjective|14 Videos

Similar Questions

Explore conceptually related problems

The voltage V and current I v graphs for a conductor at two different temperatures T_(1) and T_(2) are shown in the figure. The relation between T_(1) and T_(2) is

The V - i graph for a conductor at temperature T_(1) and T_(2) are as shown in the figure. ( T_(2) - T_(1)) is proportional to

I-V graph for a metallie wire at two different tempearture, T_(1)and T_(2) is as shown in the figure. Which of the two temperatures is lower and why ?

The current (I) and voltage (V) graphs for a given metallic wire at two different temperature (T_(1)) and (T_(2)) are shown in fig. It is concluded that

The isothermal diagram of a gas at three different temperatures T_(1),T_(2) and T_(3) , is show in the given figure .Then

The stress-strain graph for a metallic wire is shown at two different temperature, T_(1) and T_(2) which temperature is high T_(1) or T_(2) ?

The current - voltage graphs for a given metallic wire at two different temperatures T_1 and T_2 are shown in the figure. The temperature T_2 is greater than T_1 .

The current - voltage graphs for a given metallic wire at two different temperatures T_1 and T_2 are shown in the figure. The temperature T_2 is greater than T_1 .

Draw a V-I graph for a conductor at two different temperatures. What conclusion do you draw from your graph for the variation of resistance of the conductor with temperature ?

The p-V diagrams of same mass of a gas are drawn at two different temperatues T_(1) and T_(2) Explain whether T_(1)gtT_(2) or T_(2)gtT_(1).

ALLEN-CURRENT ELECTRICITY-EXERCISE-IV A
  1. By a cell a current of 0.9 A flows through 2 ohm resistor and 0.3 A th...

    Text Solution

    |

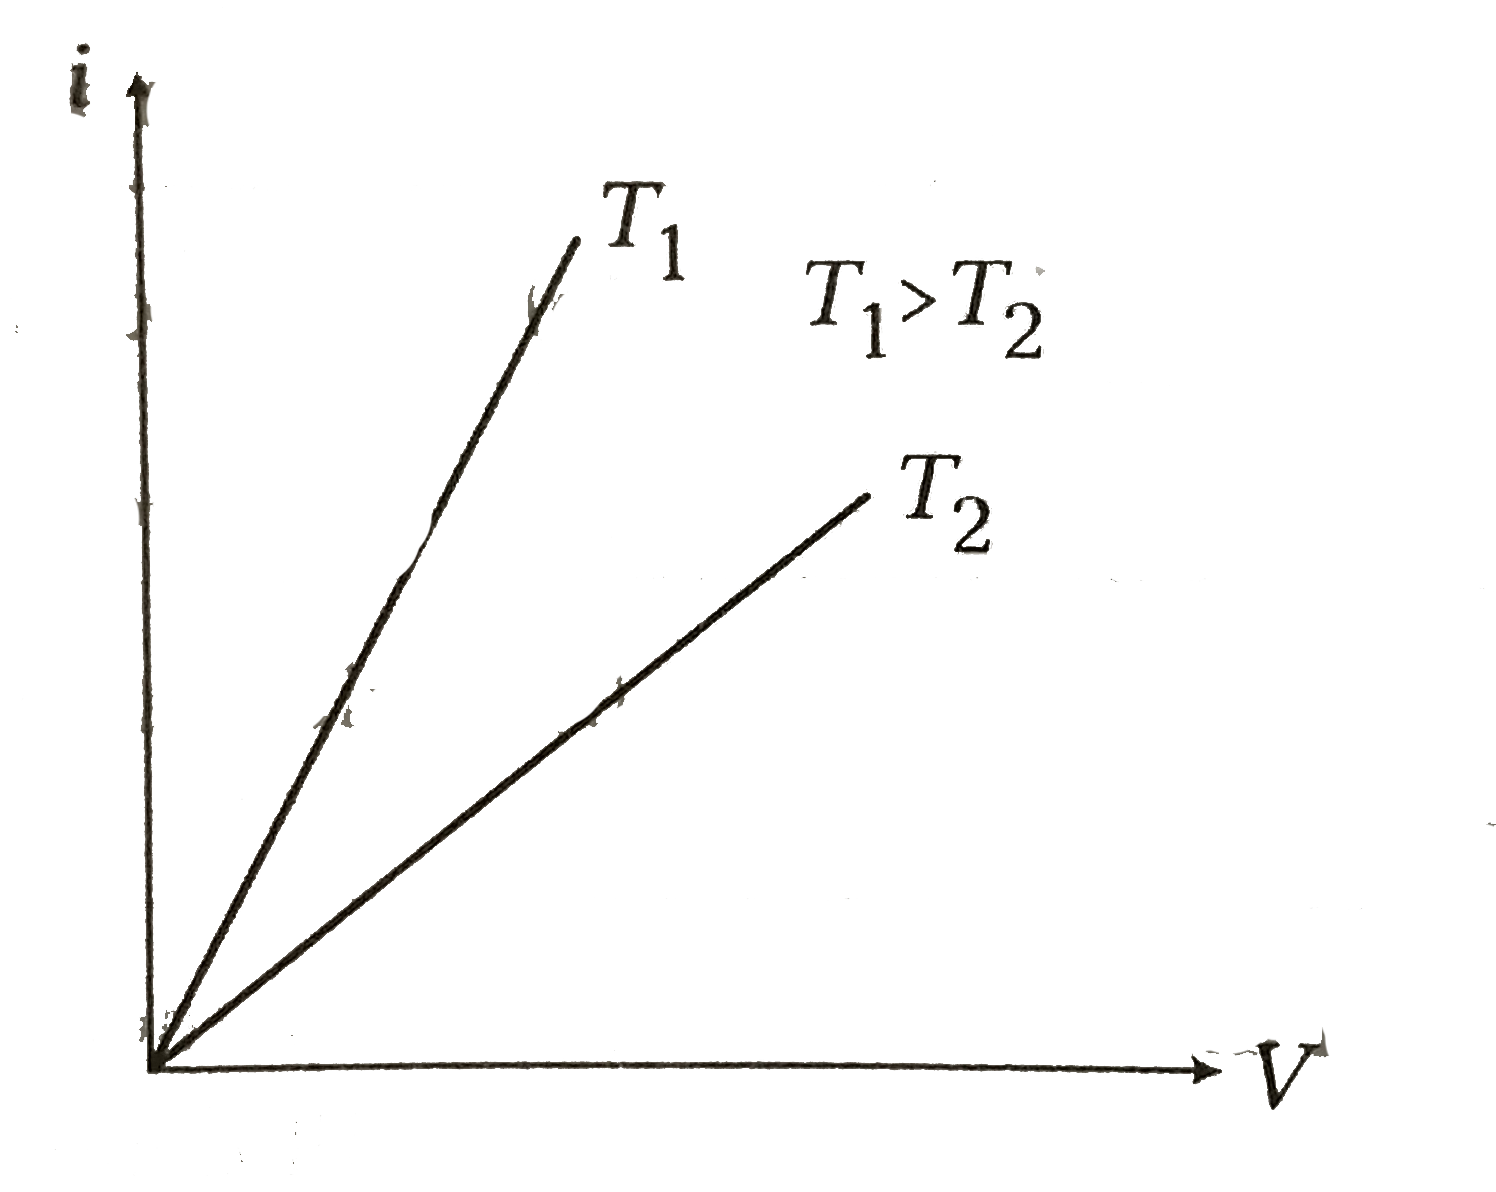
  2. Assertion : Current versus potential difference (i-V) graph for a cond...

    Text Solution

    |

  3. A galvanometer of resistance 100 Omega gives full scale deflection ...

    Text Solution

    |

  4. For changing the range of a galvanometer with G ohm resistance fromV v...

    Text Solution

    |

  5. The specific resistance of a conductor increases with

    Text Solution

    |

  6. For a cell, the terminal potential difference is 2.2 V, when circuit i...

    Text Solution

    |

  7. N identical cells whether joined together in series or in parallel, gi...

    Text Solution

    |

  8. The potential difference between the points A and B in the following c...

    Text Solution

    |

  9. Length of a potentiometer wire is kept long and uniform to ahcieve:-

    Text Solution

    |

  10. Consider four circuits shown in the figure below. In which circuit pow...

    Text Solution

    |

  11. Find the equivalent resistance across AB :

    Text Solution

    |

  12. There are three voltmeters of the same range but of resistance 10000 O...

    Text Solution

    |

  13. In the circuit element given here, if the potential at point B, V(B)=0...

    Text Solution

    |

  14. A copper wire has a square cross-section, 2.0 mm on a side. It carr...

    Text Solution

    |

  15. The emf of a battery is 2V and its internal resistance is 0.5Omega the...

    Text Solution

    |

  16. The potential difference across the 100Omega resistance in the circuit...

    Text Solution

    |

  17. The equivalent resistance between the point P and Q in the network giv...

    Text Solution

    |

  18. When connected across the terminals of a cell, a voltmeter measures 5 ...

    Text Solution

    |

  19. Thirteen resistances each of resistance R ohm are connected in the cir...

    Text Solution

    |

  20. A group of N cells whose emf varies directly with the internal resista...

    Text Solution

    |