Text Solution
Verified by Experts
The correct Answer is:


Topper's Solved these Questions
PHOTOSYNTHESIS IN HIGHER PLANTS
ALLEN|Exercise Diagram Based Questions|4 VideosPHOTOSYNTHESIS IN HIGHER PLANTS
ALLEN|Exercise Match the column|3 VideosPHOTOSYNTHESIS IN HIGHER PLANTS
ALLEN|Exercise Fill in the Blanks|8 VideosORIGIN & EVOLUTION OF LIFE
ALLEN|Exercise EXERCISE-IV (ASSERTION & REASON)|25 VideosPLANT DIVERSITY (Taxonomy to History of Taxonomy)
ALLEN|Exercise S|51 Videos
Similar Questions
Explore conceptually related problems
ALLEN-PHOTOSYNTHESIS IN HIGHER PLANTS-True & False
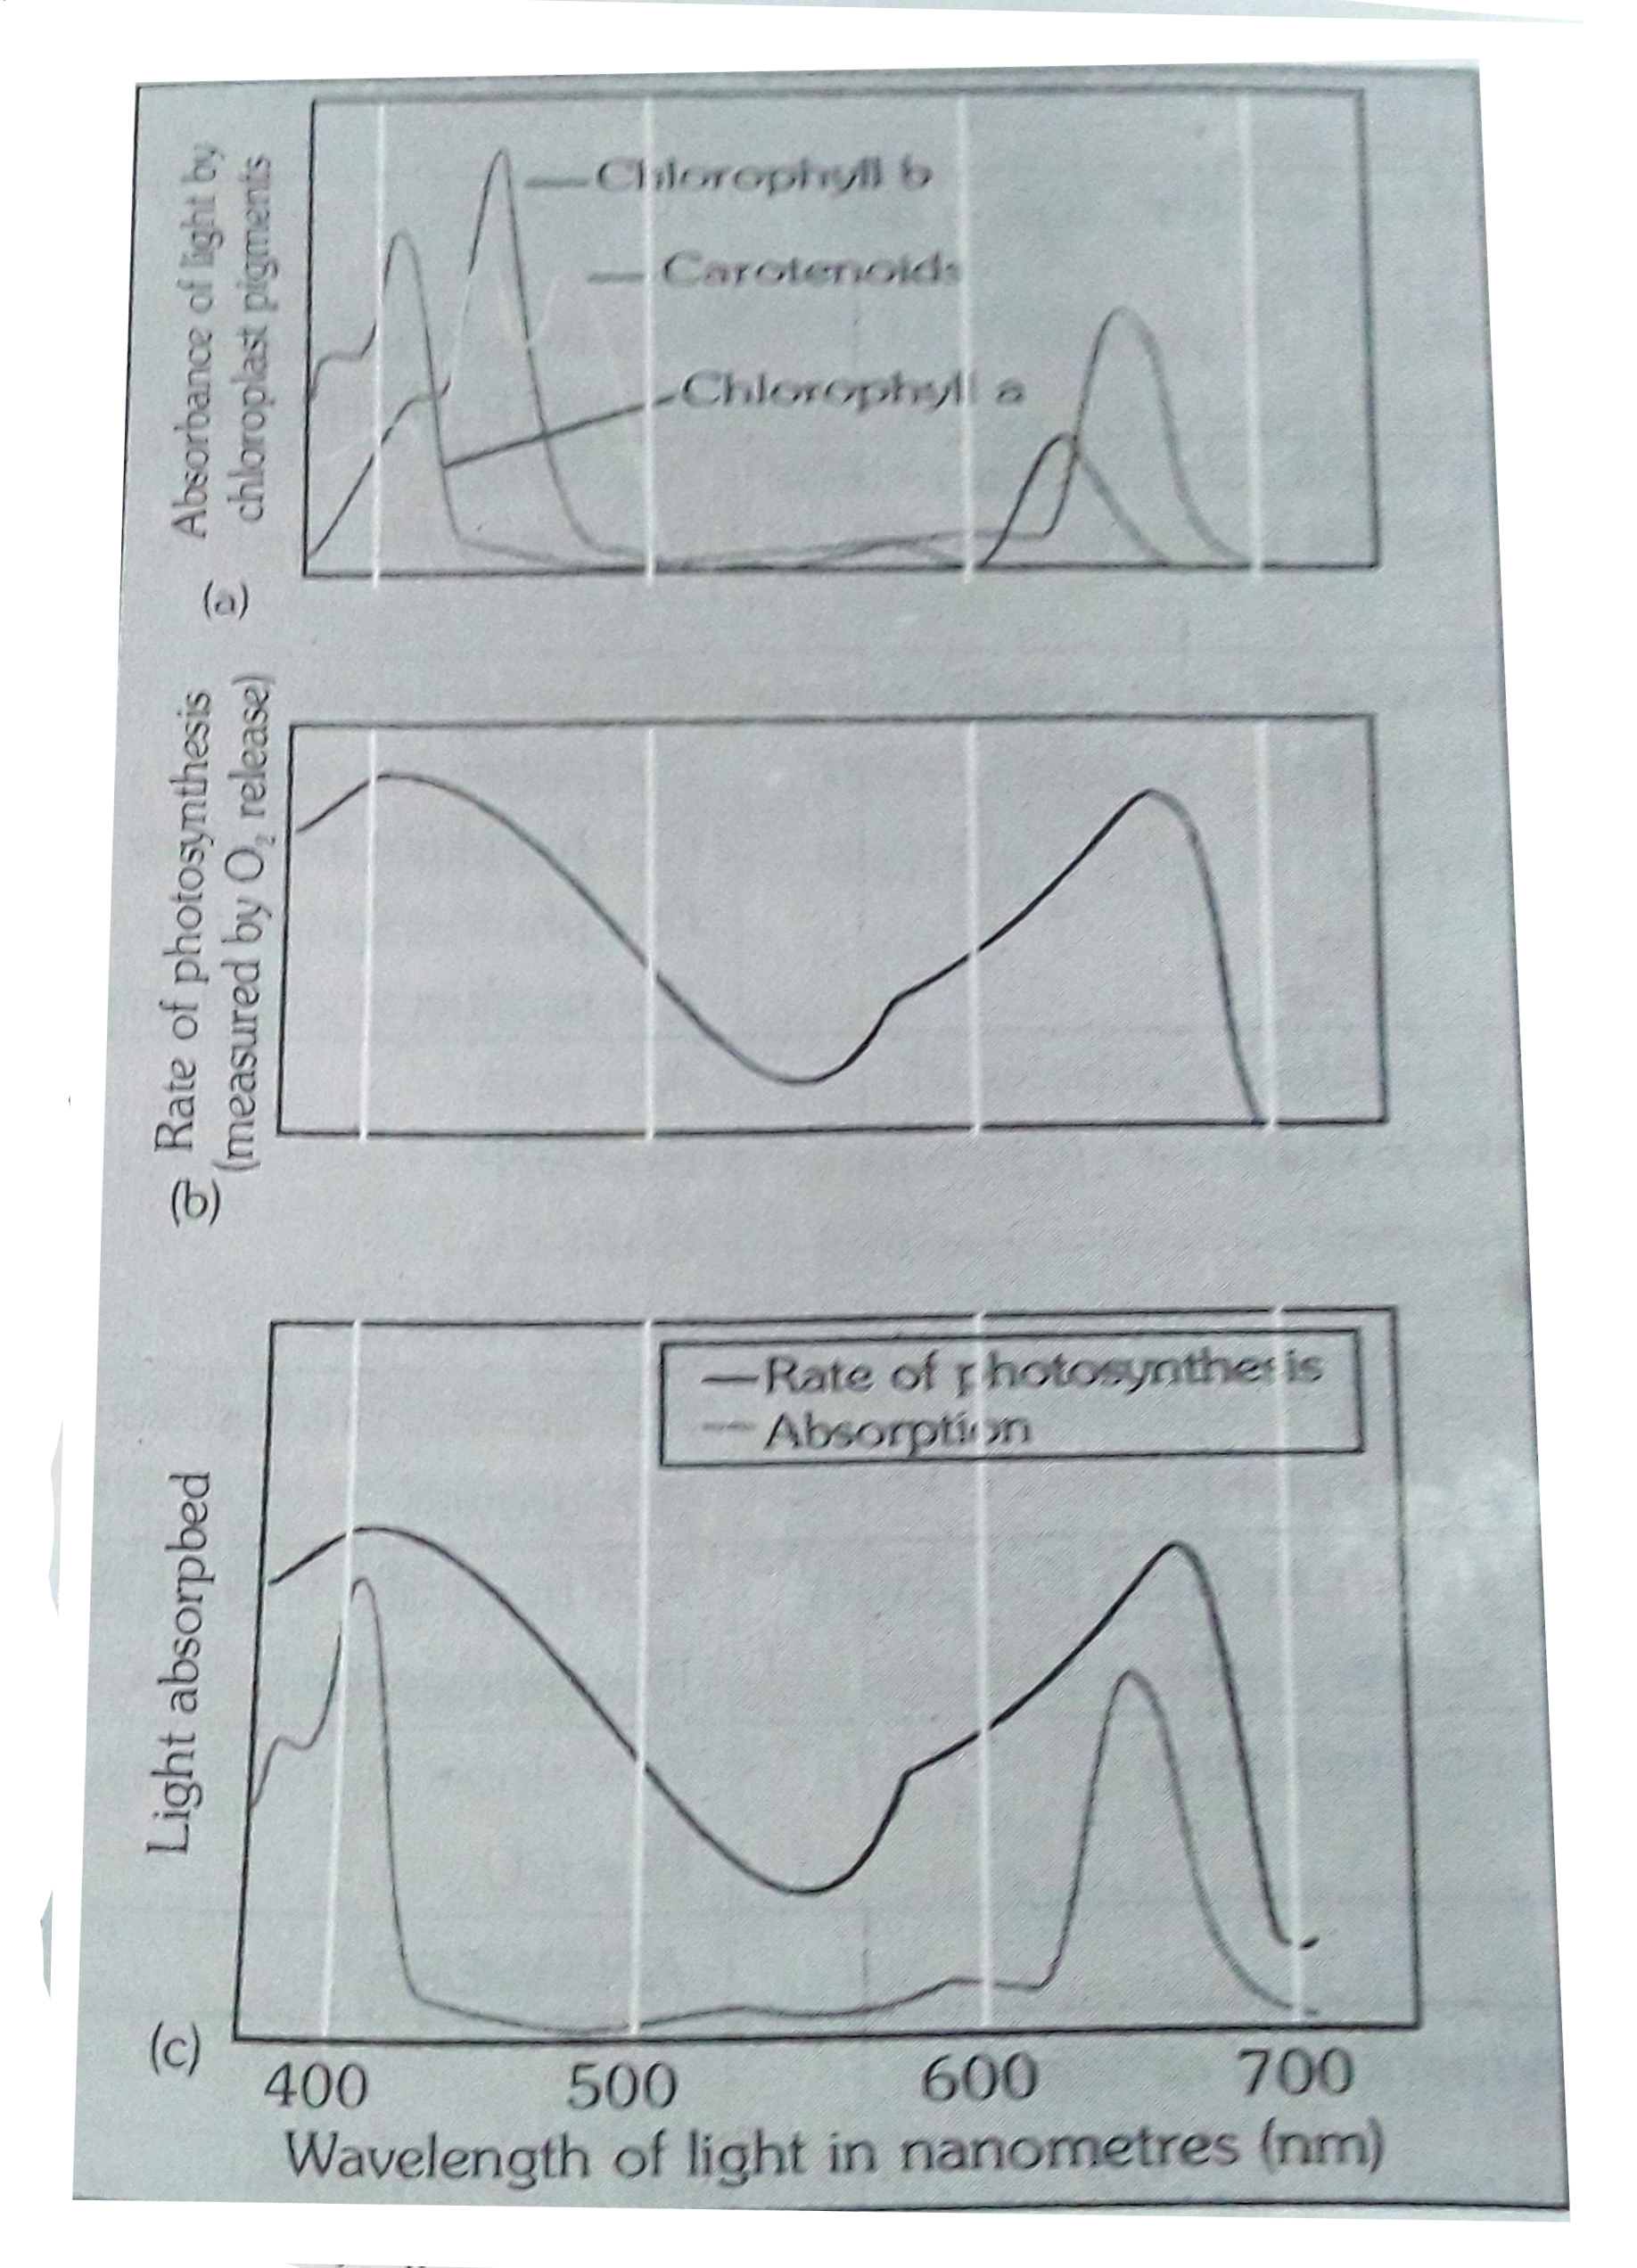
- By observing given figure mark the given statement true or false. ...
Text Solution
|
- Observe the following graphs carefully and select the true or false st...
Text Solution
|
- Photosystem I (PS I) and photosystem II (PS II) are named in the seque...
Text Solution
|
- The chlorophyll 'a' molecule forms the 'reaction centre' in photosyste...
Text Solution
|
- Calling the biosynthetic phase of photosynthesis as the dark reaction ...
Text Solution
|
- Observe the given diagrammatic representation of the Hatch and slack p...
Text Solution
|