Home
Class 12
BIOLOGY
The given graph shows the change in DNA ...

The given graph shows the change in DNA content in a single cell during the mitosis which stage occurs between the time x and y ?

A

Interphase

B

Prophase

C

Anaphase

D

Telophase

Text Solution

Verified by Experts

The correct Answer is:
A
Promotional Banner

Topper's Solved these Questions

  • PLANT GROWTH AND DEVELOPMENT

    ALLEN|Exercise Match the Column|2 Videos
  • POLLUTION (ENVIRONMENTAL ISSUES)

    ALLEN|Exercise S|22 Videos

Similar Questions

Explore conceptually related problems

The given graph shows the change in DNA content during various phases (A to D) in a typical mitotic cell cycle. Identify the phases and select the correct option.

The stage during which synapsis occurs between homologous chromosomes is

A particle starts its motion from the origin in positive x-direction. The given graph shows the variation of acceleration (a) with velocity (v). Plot the corresponding graph between velocity and time.

The given diagram shows a stage during mitotic division in an animal cell: Identify the stage. Give a reason to support your answer.

The given diagram shows a stage during mitotic division in an animal cell: Name the type of cell division that occurs during: A. Growth of a shoot B. Formation of pollen grains.

Look at the change of state diagram from gas to solid given here carefully, and answer the following questions. a. During freezing, certain amount of heat is given out without any change in temperature. Which part of the graph shows this change? b. During condensation, certain amount of heat is given out without any change in temperature. Which part of the graph shows this change? c. Which point on the graph corresponds to İ. condensation point? ii. freezing point? d. What do ab and cd on the graph represent?

The given diagram shows a stage during mitotic division in an animal cell: In what two ways is mitotic division in an animal cell different from the mitotic division in a plant cell?

The ion which shows active influx into guard cells during day time in a photoactive stomata

ALLEN-PLANT PHYSIOLOGY : PHOTOSYNTHESIS IN HIGHER PLANTS-S
  1. If the diploid number of chromosomes is 40, then number of chromosome ...

    Text Solution

    |

  2. Chromosome number is reduced during meiosis because the process consis...

    Text Solution

    |

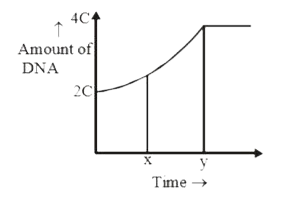
  3. The given graph shows the change in DNA content in a single cell durin...

    Text Solution

    |

  4. Metabolically active cells, of the adult animal's heart, are remain in...

    Text Solution

    |

  5. Identify the phases of mitosis from given diagrams :-

    Text Solution

    |

  6. Given diagrams shows the phases of meiosis. Identify the phases :-

    Text Solution

    |

  7. Recombination between homologous chromosomes is completed by the end o...

    Text Solution

    |

  8. Due to the activity of recombinase enzyme, an X-shaped structure is ob...

    Text Solution

    |

  9. Determine the stage at which the following structure is visible :-

    Text Solution

    |

  10. In animal cells, during the S-phase -

    Text Solution

    |

  11. Match the above figures (a, b, c) with their events given below :- (...

    Text Solution

    |

  12. Sequence that correctly describes the cell cycle is:-

    Text Solution

    |

  13. Transpiration pull :-

    Text Solution

    |

  14. Mark the incorrect one with reference to stomatal opening according to...

    Text Solution

    |

  15. A vein differ from an artery in having :-

    Text Solution

    |

  16. Which of the following is not associated with guttation ?

    Text Solution

    |

  17. Simple as well as facilitated diffusion both (correct one) –

    Text Solution

    |

  18. Transpiration rate mainly depends on –

    Text Solution

    |

  19. What is correct about root pressure ?

    Text Solution

    |

  20. On the basis of following diagram identify the correct direction of wa...

    Text Solution

    |