A
B
C
D
Text Solution
Verified by Experts
The correct Answer is:


Similar Questions
Explore conceptually related problems
Recommended Questions
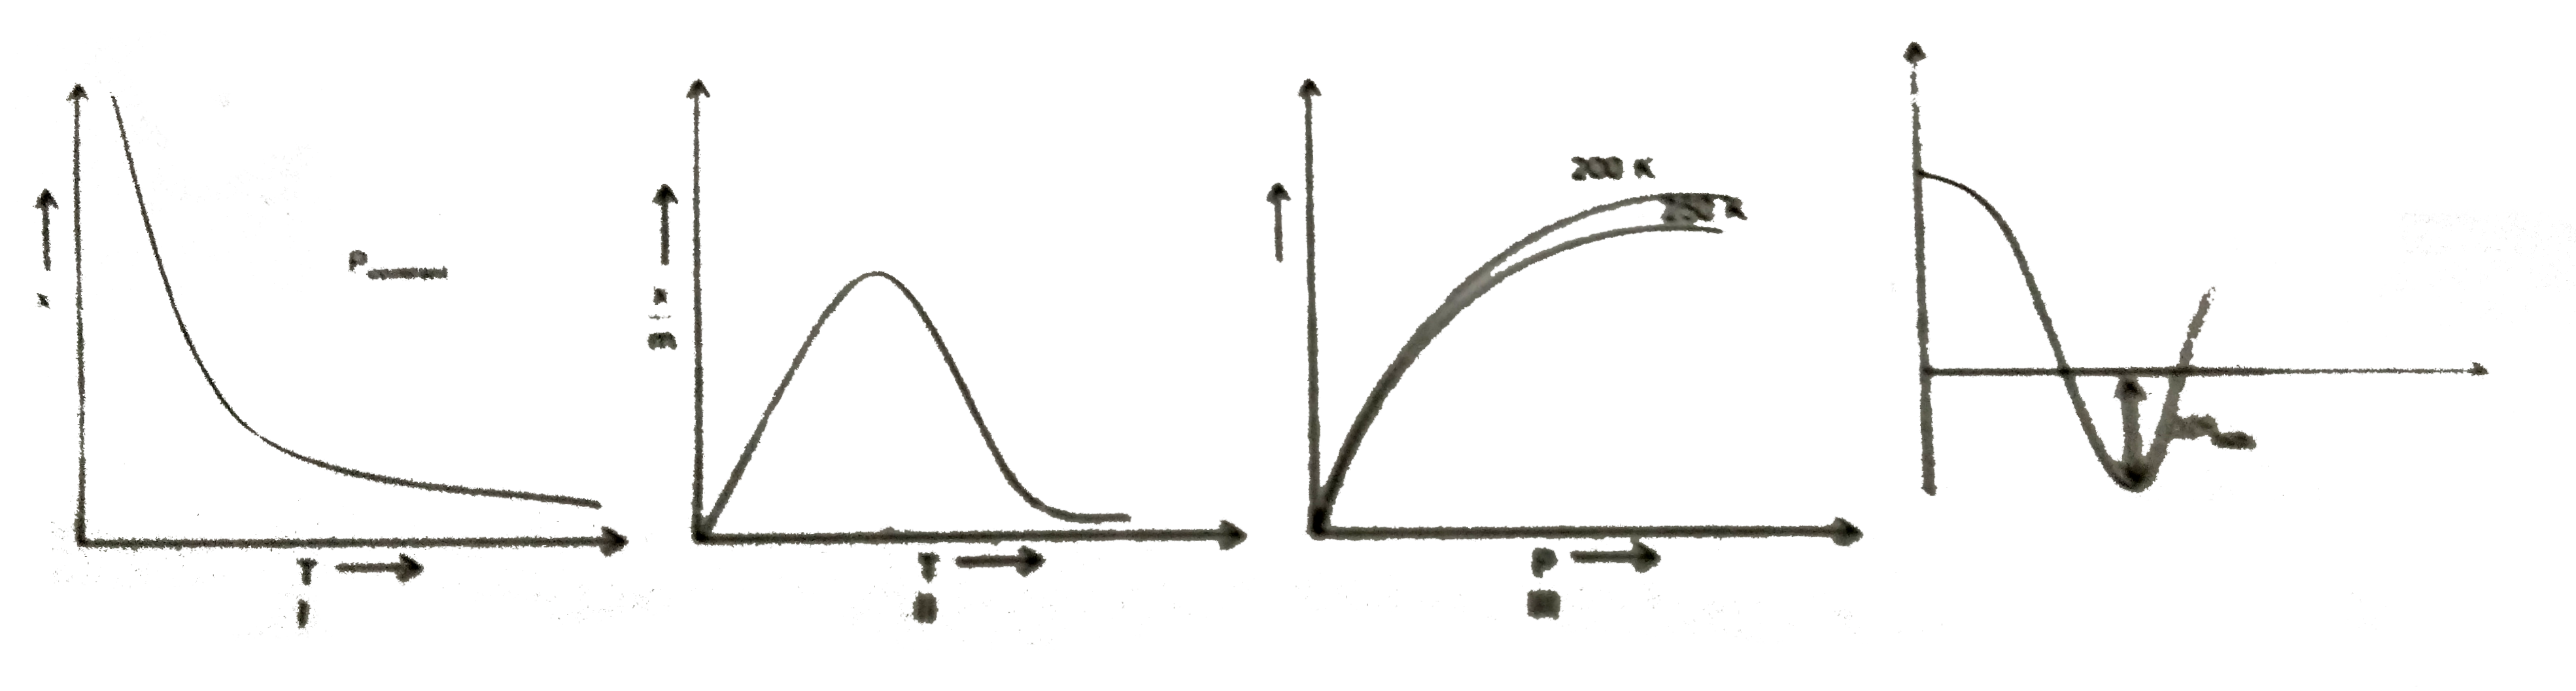
- X=amount of gas adsorbed P=Pressure T=Temperature L=Physisorptio...
Text Solution
|
- The correct statements pertaining to the adsorption of a gas on a soli...
Text Solution
|
- Which plot is the adsorption isobar for chemisorption where x is...
Text Solution
|
- The given graph/data I,II,III and IV represent general trends observed...
Text Solution
|
- Write the differences between physisorption and chemisorption with res...
Text Solution
|
- The given graph/data I, II, III and IV represent general trends observ...
Text Solution
|
- निम्न में से कौन-सा ग्राफ रासायनिक अधिशोषण के लिए है, जहा x गैस की वह ...
Text Solution
|
- Assertion : Physisorption of a gas adsorbed at low temperature may cha...
Text Solution
|
- Which plot is the adsorption isobar for chemisorption where x is the a...
Text Solution
|