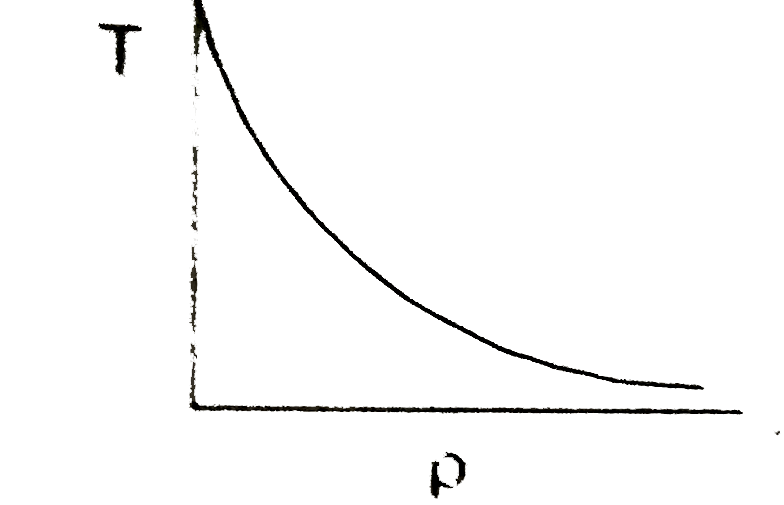
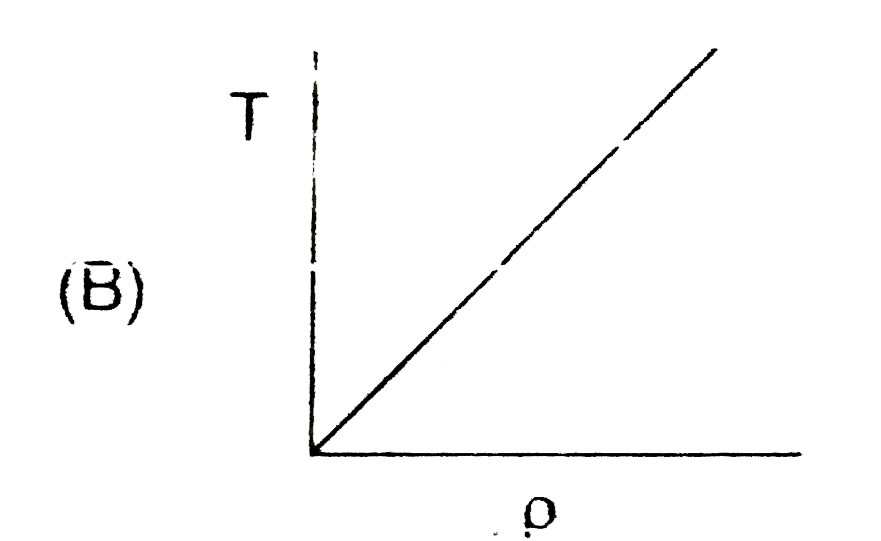
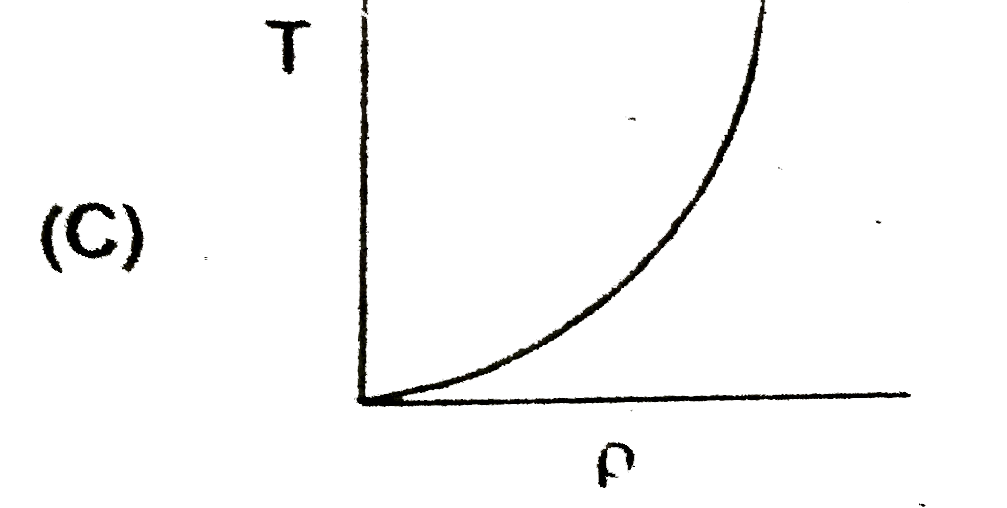
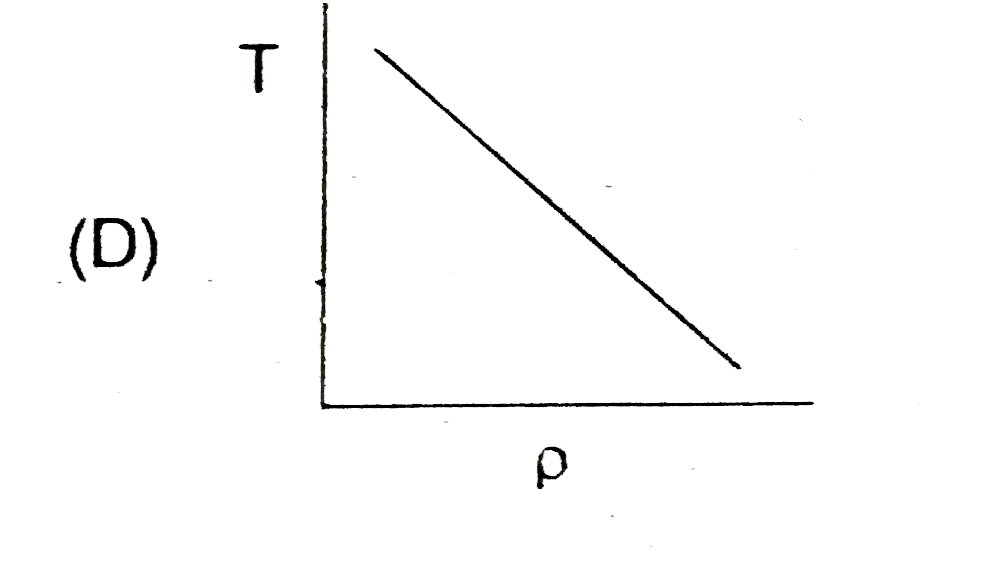
Home
Class 12
CHEMISTRY
Which of the following is a graph of the...

Which of the following is a graph of the relation of the density `(rho)` of a gas sample to the absolute tempeature keeping constant pressure.

A

B

C

D

Text Solution

AI Generated Solution

The correct Answer is:
To solve the question regarding the relationship between the density (ρ) of a gas sample and the absolute temperature (T) while keeping the pressure constant, we can follow these steps: ### Step 1: Understand the Ideal Gas Law The ideal gas law is given by the equation: \[ PV = nRT \] Where: - \( P \) = Pressure - \( V \) = Volume - \( n \) = Number of moles - \( R \) = Universal gas constant - \( T \) = Absolute temperature ### Step 2: Relate Density to Volume Density (ρ) is defined as: \[ \rho = \frac{m}{V} \] Where: - \( m \) = Mass of the gas - \( V \) = Volume of the gas We can express the volume in terms of density: \[ V = \frac{m}{\rho} \] ### Step 3: Substitute Volume in the Ideal Gas Law Substituting the expression for volume into the ideal gas law gives: \[ P \left(\frac{m}{\rho}\right) = nRT \] ### Step 4: Express Moles in Terms of Density The number of moles \( n \) can be expressed as: \[ n = \frac{m}{M} \] Where \( M \) is the molar mass of the gas. Substituting this into the equation gives: \[ P \left(\frac{m}{\rho}\right) = \left(\frac{m}{M}\right)RT \] ### Step 5: Simplify the Equation Cancelling \( m \) from both sides (assuming \( m \neq 0 \)): \[ \frac{P}{\rho} = \frac{RT}{M} \] ### Step 6: Rearranging the Equation Rearranging the equation gives: \[ \rho = \frac{PM}{RT} \] ### Step 7: Analyze the Relationship From the equation \( \rho = \frac{PM}{RT} \), we can see that: - When pressure \( P \) and molar mass \( M \) are constant, density \( \rho \) is inversely proportional to temperature \( T \). - This means that as temperature increases, density decreases, and vice versa. ### Step 8: Determine the Graph The relationship \( \rho \propto \frac{1}{T} \) indicates that the graph of density versus temperature will be a hyperbola that decreases as temperature increases. Therefore, the correct graph will show a decrease in density with an increase in temperature. ### Conclusion The correct answer to the question is option A, which reflects the inverse relationship between density and temperature at constant pressure. ---

To solve the question regarding the relationship between the density (ρ) of a gas sample and the absolute temperature (T) while keeping the pressure constant, we can follow these steps: ### Step 1: Understand the Ideal Gas Law The ideal gas law is given by the equation: \[ PV = nRT \] Where: - \( P \) = Pressure - \( V \) = Volume ...
Promotional Banner

Similar Questions

Explore conceptually related problems

Which of the following graph represents the variation of amount of chemisorption of a gas by a solid with temperature under constant pressure?

Which of the following shown the correct relationship between the pressure 'P' and density rho of an ideal gas at constant temperature?

Heat supplied to an ideal gas sample at constant Pressure :

Which graph correctly represents variation between relaxation time (t) of gas molecules with absolute temperature of gas T.

Which graph correctly represents variation between relaxation time (t) of gas molecules with absolute temperature of gas T.

which one of the following graph is not correct for ideal gas ? d=density ,P=pressure,T=Temperature

From the graph the order of pressure of a gas is

When the pressure of a gas is doubled under constant temperature the density becomes

Write down the relation connecting the pressure and temperature of a gas if volume is kept constant.

Which of the following graphs is inconsistent with ideal gas behaviour ? (Assume n = constant)