A
B
C
D
Text Solution
Verified by Experts
The correct Answer is:


Similar Questions
Explore conceptually related problems
Recommended Questions
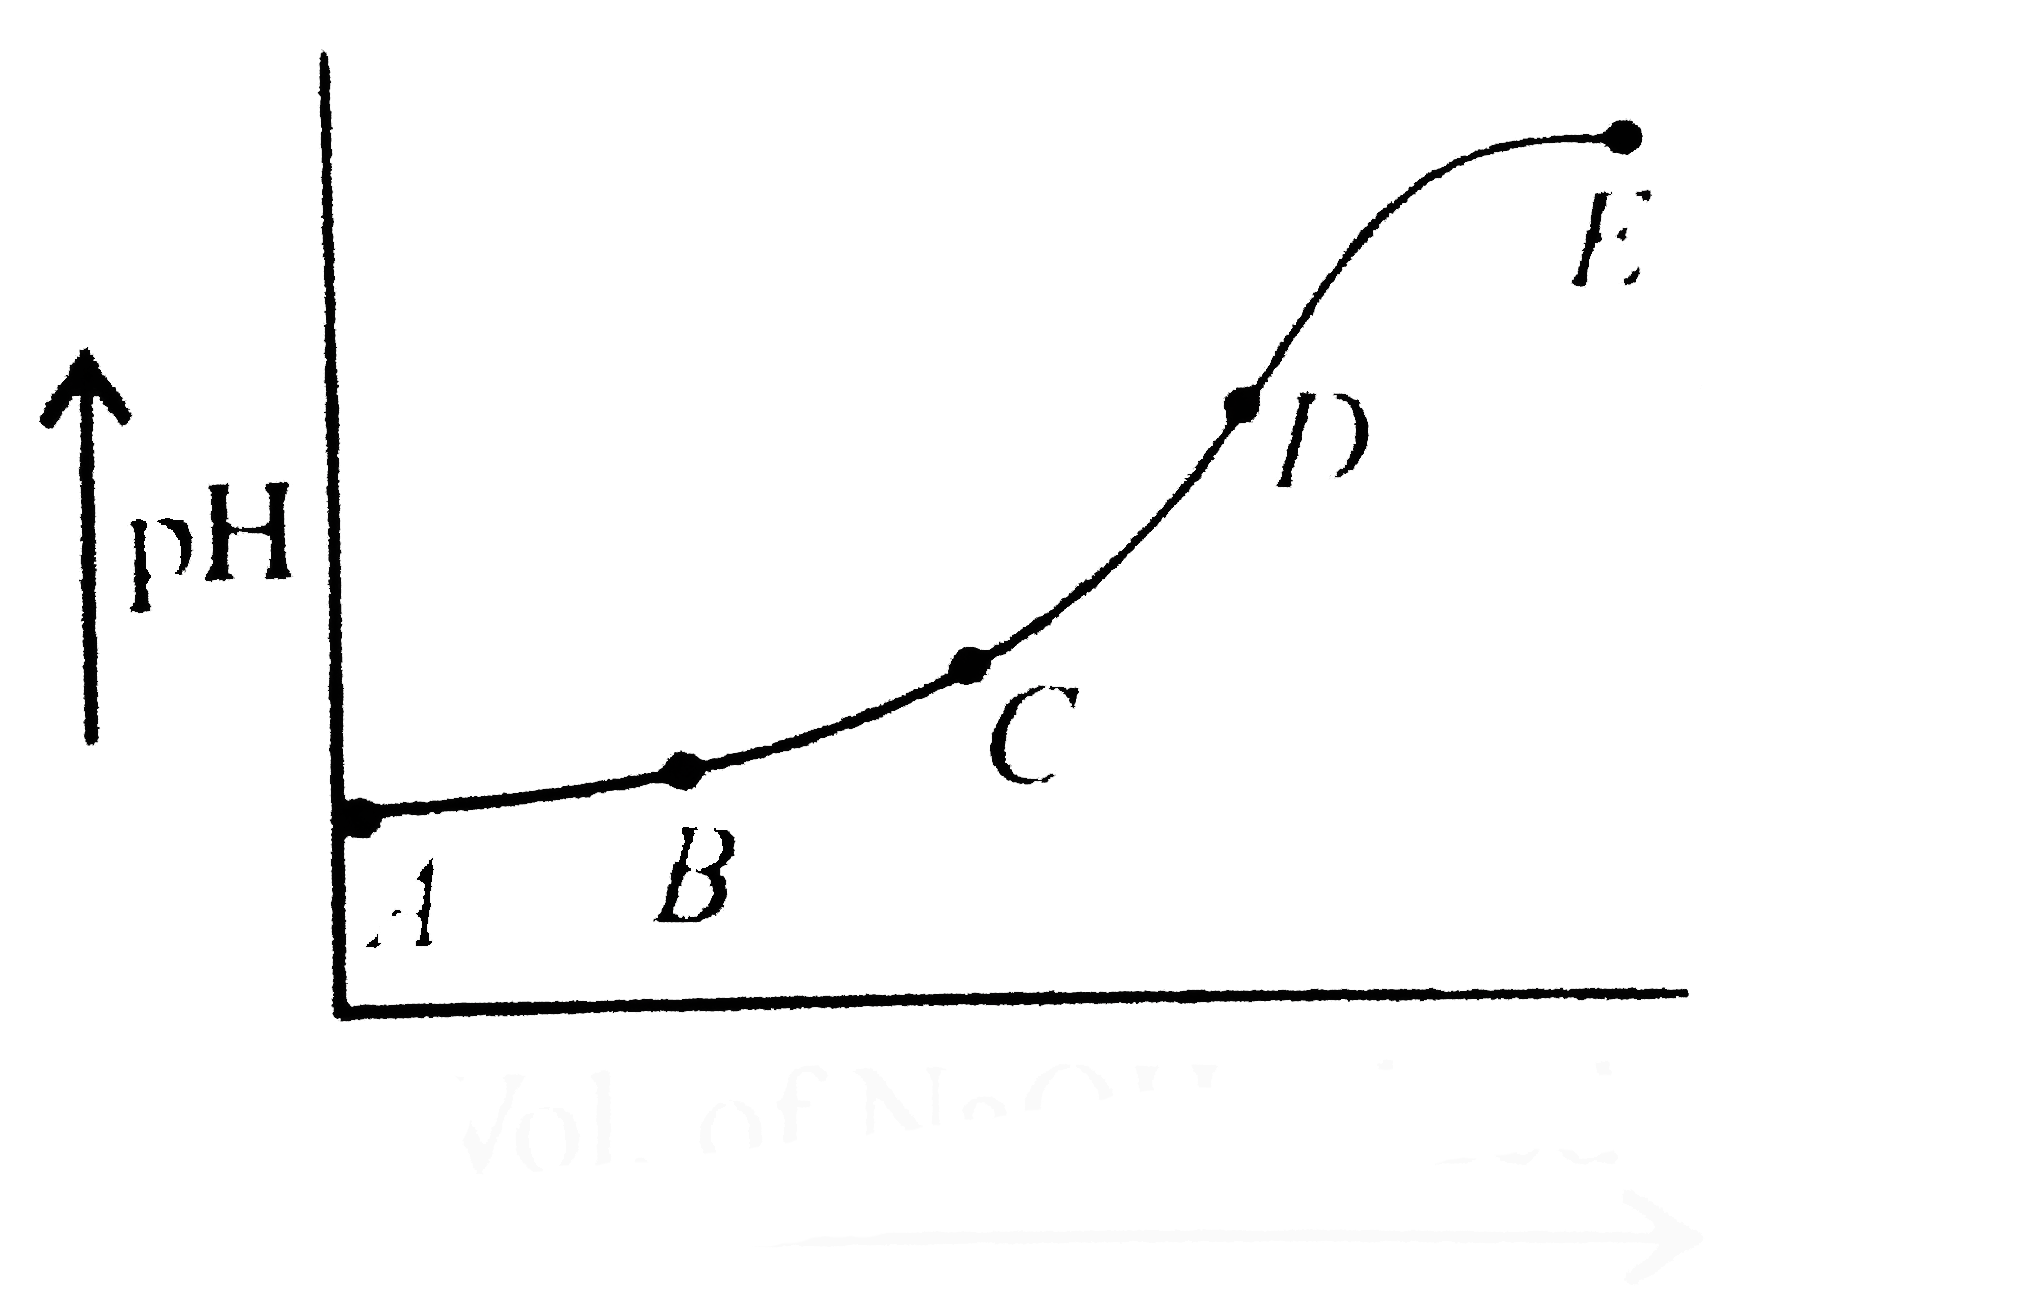
- The following curve shows the change of pH during the course of titrat...
Text Solution
|
- The following curve shows the change of pH during the course of titrat...
Text Solution
|
- During the titration of a weak base with a strong acid, one should use...
Text Solution
|
- Which of the following curves corresponds to the titration of a weak b...
Text Solution
|
- When a strong acid is titrated using a weak base, the pH at the equiva...
Text Solution
|
- Which of the following pH curve represent the titration of weak acid a...
Text Solution
|
- A strong acid is titrated with weak base. At equivalence point, pH wil...
Text Solution
|
- Acid base titration curve
Text Solution
|
- At half - equivalence point in the titration of weak acid by a str...
Text Solution
|