


Similar Questions
Explore conceptually related problems
Recommended Questions
- Figure shows the VT diagram for helium gas in a cyclic process. Equati...
Text Solution
|
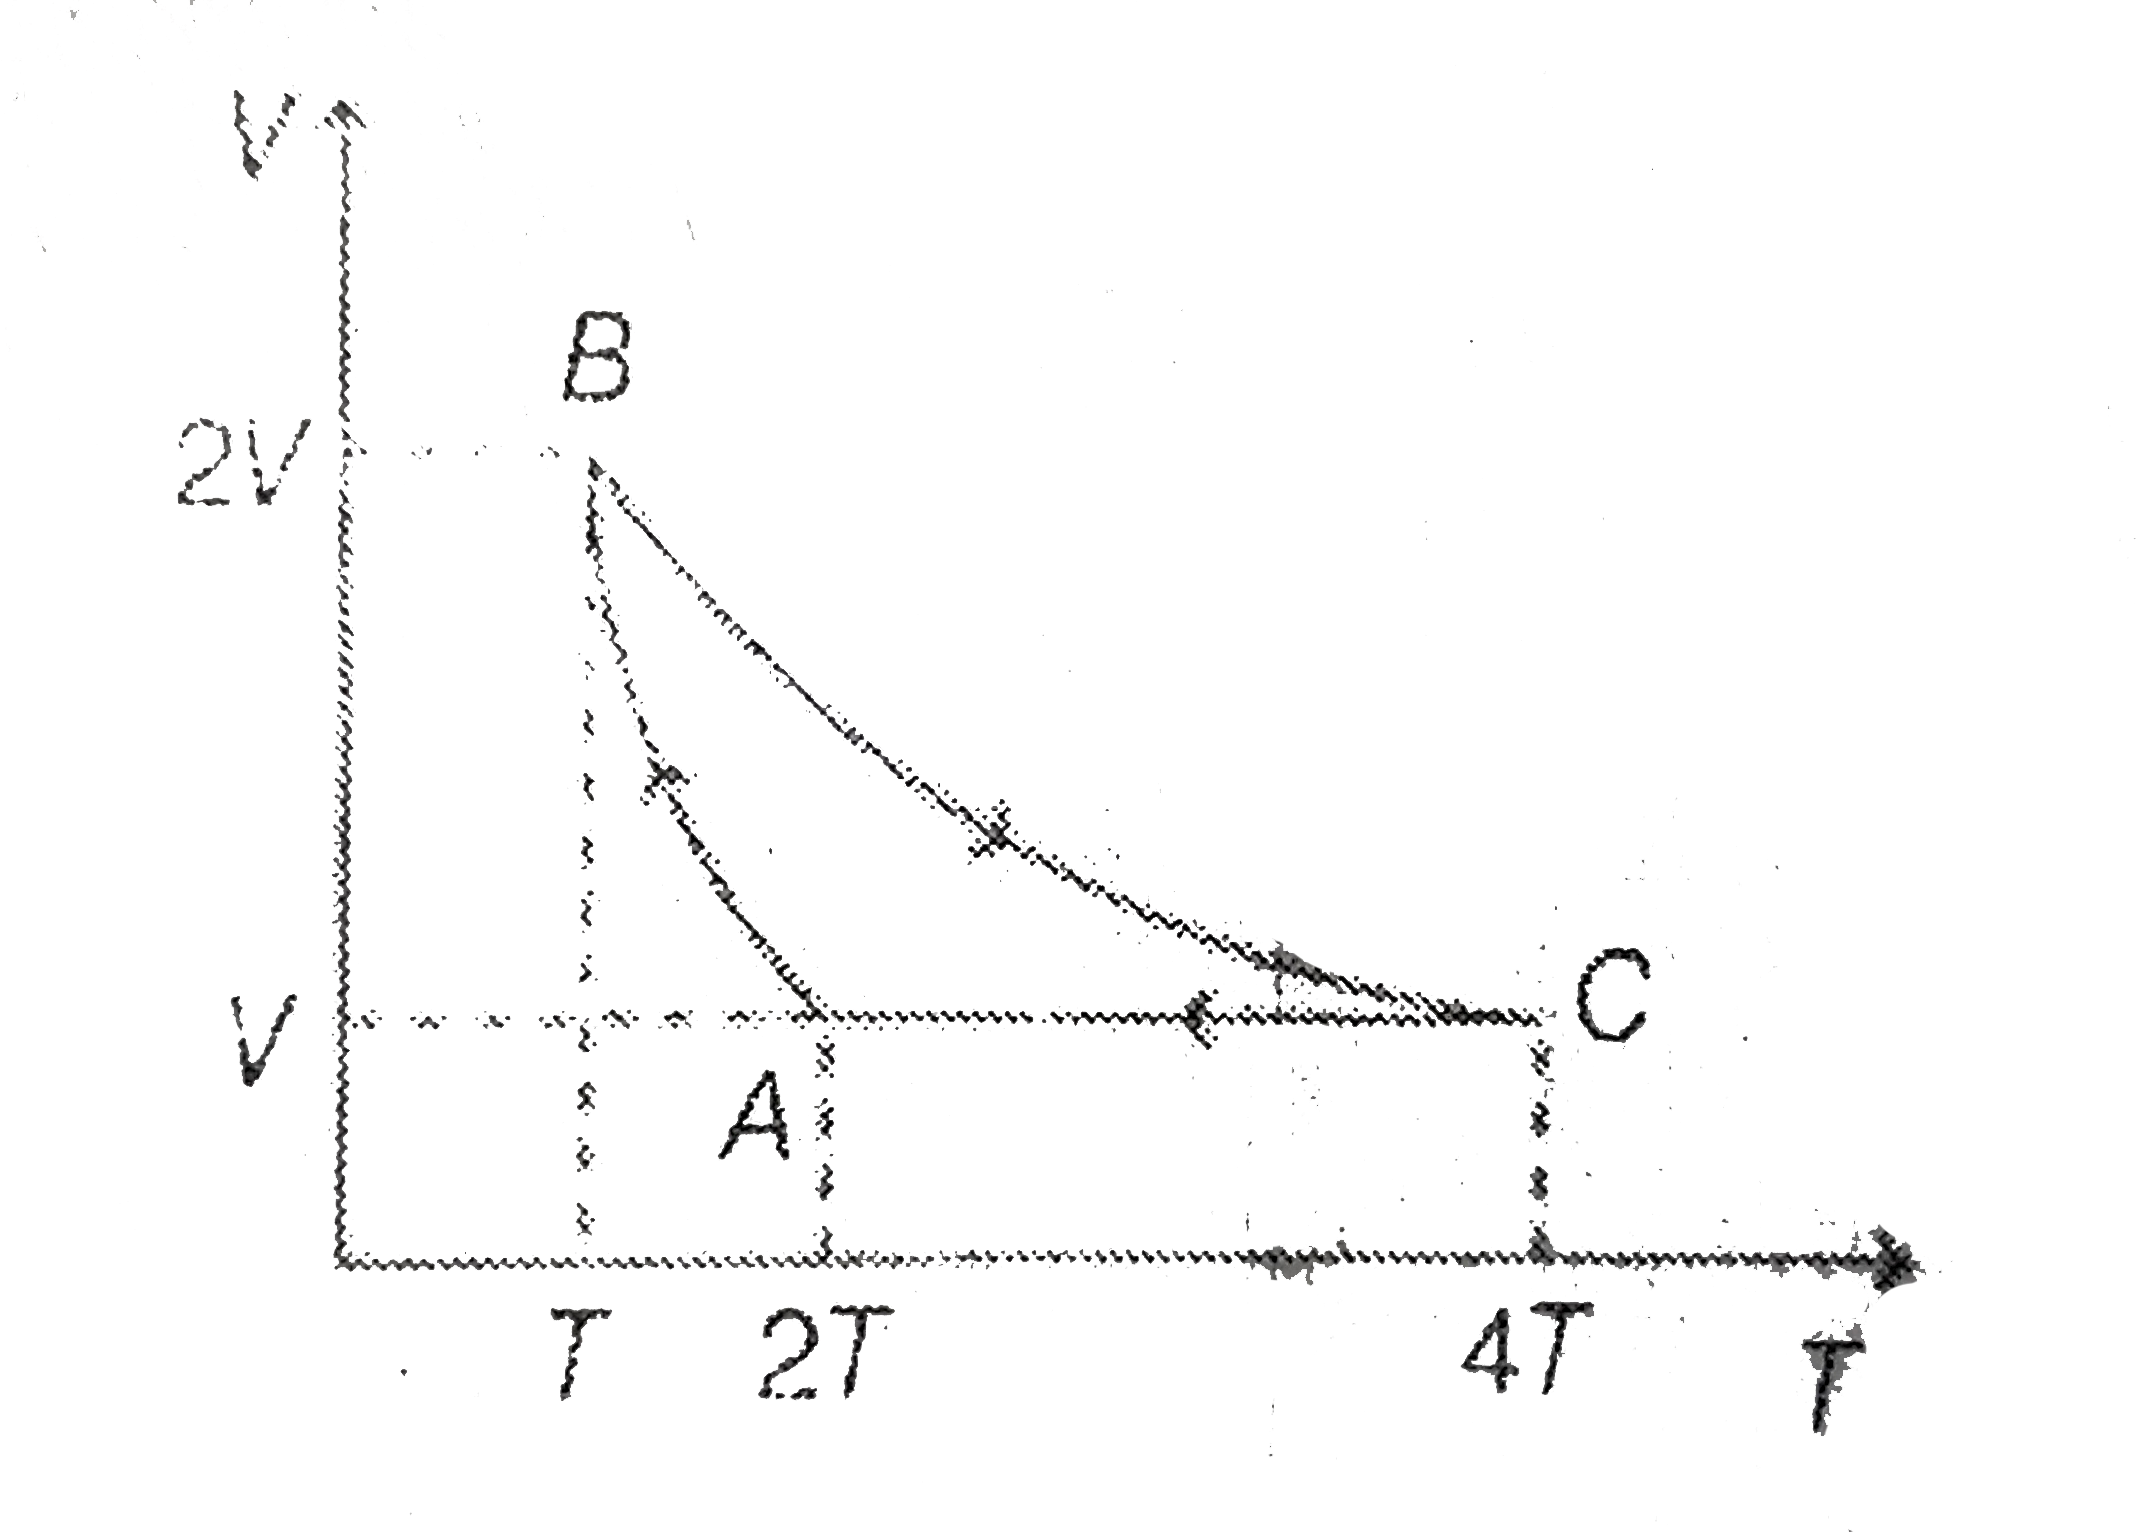
- A cyclic process ABCA shown in the V-T diagram is performed with a con...
Text Solution
|
- Two moles of an ideal monoatomic gas is taken through a cyclic process...
Text Solution
|
- Two moles of an ideal diatomic gas is taken through a process VT^(2)= ...
Text Solution
|
- Two moles of an ideal monoatomic gas undergoes a process VT = constant...
Text Solution
|
- Consider PT graph of cyclic process shown in the figure. Maximum press...
Text Solution
|
- Figure shows the VT diagram for helium gas in a cyclic process. Find t...
Text Solution
|
- Figures (a), (b) and (c) depict three cyclic processes in the pV-, VT-...
Text Solution
|
- A cyclic process ABCD is shown in VT diagram for an ideal gas. Which o...
Text Solution
|