A
B
C
D
Text Solution
Verified by Experts


Similar Questions
Explore conceptually related problems
Recommended Questions
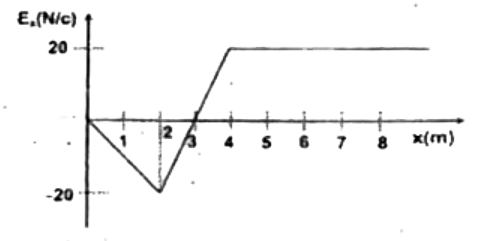
- A graph of the x-component of the electric field as a function of x in...
Text Solution
|
- In a certain region of space, the electric potential is V (x, y, z) = ...
Text Solution
|
- A graph of the x-component of the electric field as a function of x in...
Text Solution
|
- In an electric field region, the electric potential varies along the x...
Text Solution
|
- In a certain region of space the electric potential V is known to be ...
Text Solution
|
- In a certain region of space, the electric field is zero. From this, w...
Text Solution
|
- The figure gives the electric potential V as a function of distance th...
Text Solution
|
- The electric potential as a function of distance 'x' is shown in the f...
Text Solution
|
- The figure below shows two equipotential surfaces in X-Y plane for an ...
Text Solution
|