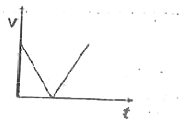
A
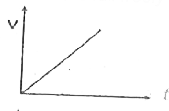
B
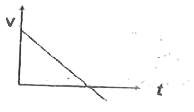
C
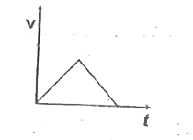
D
Text Solution
Verified by Experts
The correct Answer is:


Similar Questions
Explore conceptually related problems
Recommended Questions
- Which of the following graph correctly represents velocity-time relati...
Text Solution
|
- The velocity -time of a body falling from rest under gravity and rebou...
Text Solution
|
- A particle is thrown vertically upwards with a velocity v. It returns ...
Text Solution
|
- Which of the following graph correctly represents velocity-time relati...
Text Solution
|
- A particle is projected vertically upwards with a velocity v. It retur...
Text Solution
|
- एकसमान विद्युत - क्षेत्र आवेशित कण की गति गुरुत्व के अधीन स्वतंत्रताप...
Text Solution
|
- A particle falls from rest under the action of gravity . Variation of ...
Text Solution
|
- An object falling freely under gravity close to Earth is
Text Solution
|
- The velocity - time graph of a particle falling freely under gravity w...
Text Solution
|