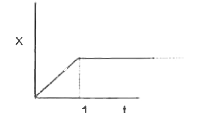
A
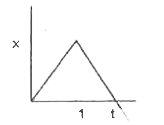
B
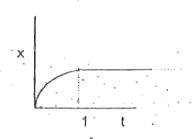
C
D
Text Solution
Verified by Experts
The correct Answer is:


Similar Questions
Explore conceptually related problems
Recommended Questions
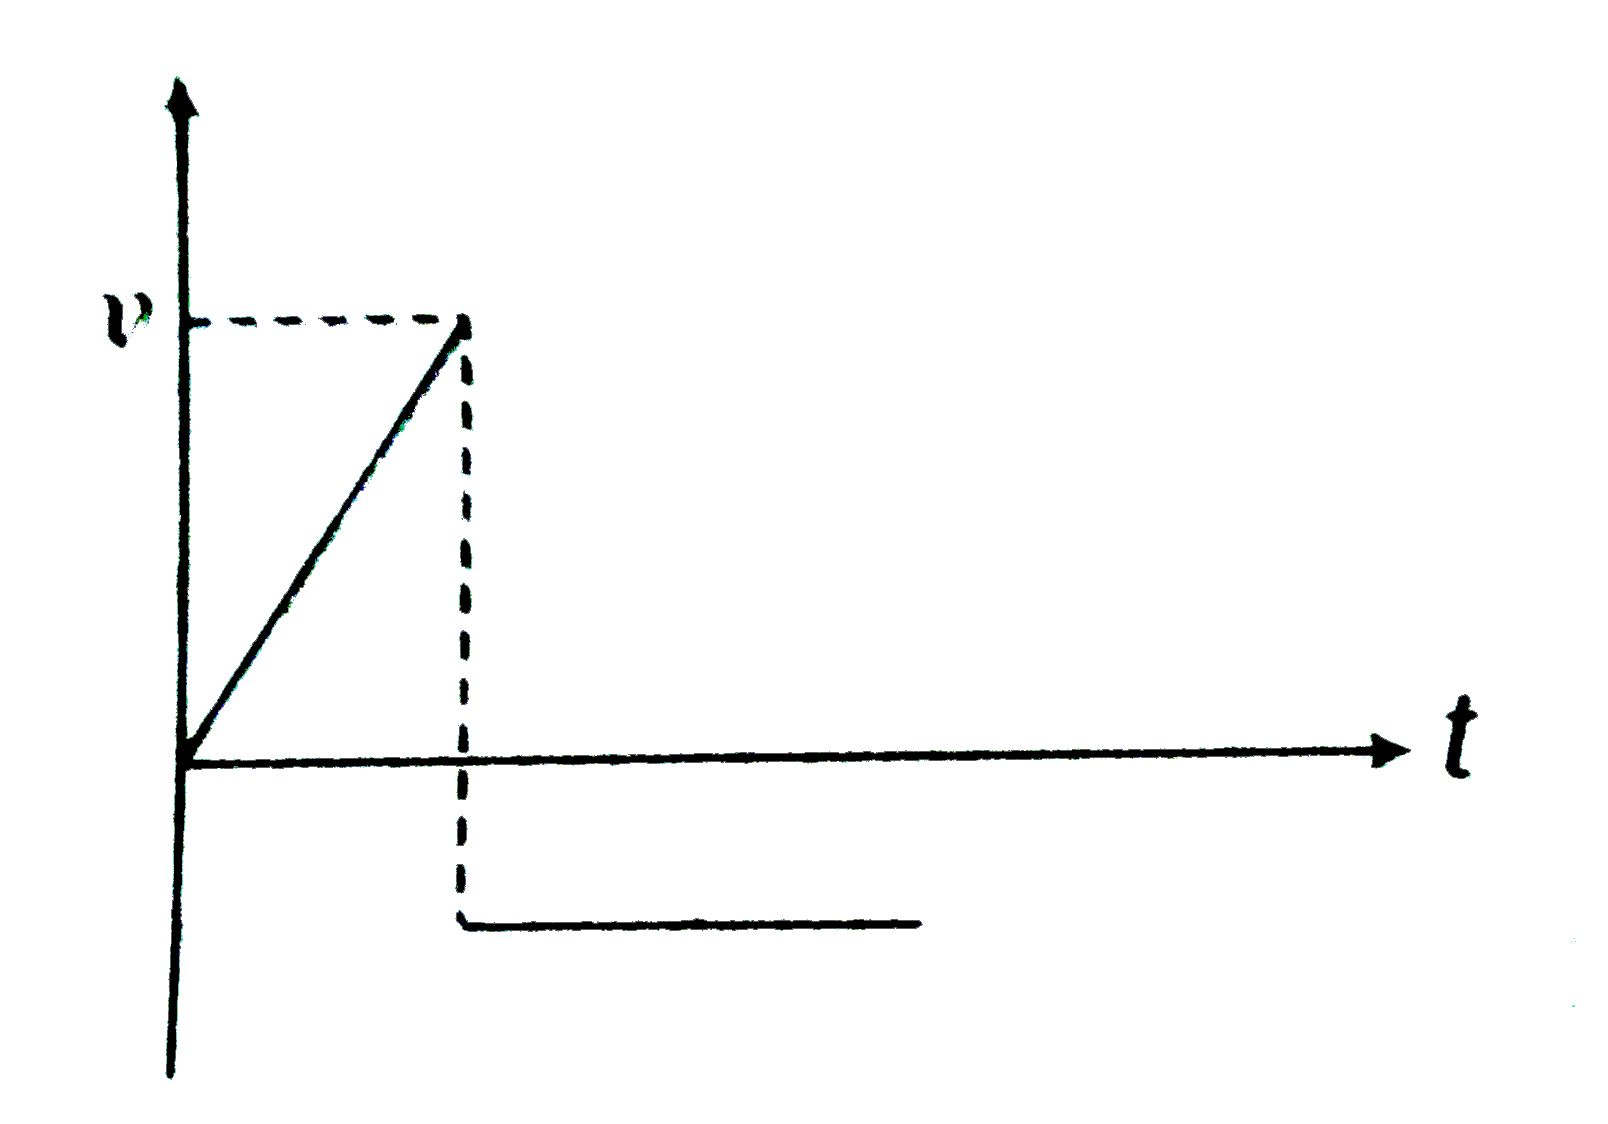
- The velocity-time graph for a particle moving along X-axis is shown in...
Text Solution
|
- The x-t graph of a particle moving along a straight line is shown in f...
Text Solution
|
- A partical is moving along the x-axis and its velocity-time graph is s...
Text Solution
|
- A particle is moving along the x-axis and its velocity-time graph ia a...
Text Solution
|
- The velocity-time graph for a particle moving along X-axis is shown in...
Text Solution
|
- For a particle moving along x-axis, velocity-time graph is as shown in...
Text Solution
|
- The velocity time graph for a particle moving along x-axis is shown in...
Text Solution
|
- The figure shows a velocity-time graph of a particle moving along a st...
Text Solution
|
- The graph of displacement vs time for a particle moving along a straig...
Text Solution
|