A
B
C
D
Text Solution
Verified by Experts
The correct Answer is:


Similar Questions
Explore conceptually related problems
Recommended Questions
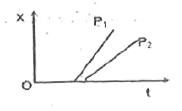
- Figure shows two displacement-time graphs of particles P(1) and P(2) ...
Text Solution
|
- Figure shows the volume versus temperature graph for the same mass of ...
Text Solution
|
- The figure shows a velocity-time graph of a particle moving along a st...
Text Solution
|
- Shown in the figure are the velocity time graphs of the two particle P...
Text Solution
|
- निम्नांकित ग्राफ में दो वस्तुओं A तथा B का विस्थापन - समय ग्राफ प्रदर्...
Text Solution
|
- यदि P(1) तथा P(2) दो विषम संख्याएँ है, जबकि p(1) gt p(2) तो p(1)^(2...
Text Solution
|
- The phase of a particle at P(1) " is " 60^(@) and the phase of a parti...
Text Solution
|
- If p(1),p(2),p(3) are altitudes of a DeltaABC then show that (1)/(...
Text Solution
|
- If p(1),p(2),p(3) are altitudes of a DeltaABC then show that (1)/...
Text Solution
|