A
B
C
D
Text Solution
Verified by Experts
The correct Answer is:


Similar Questions
Explore conceptually related problems
Recommended Questions
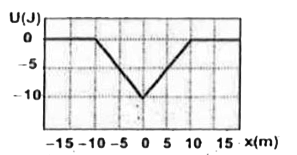
- Figure shows a graph of potential energy. Consider the following...
Text Solution
|
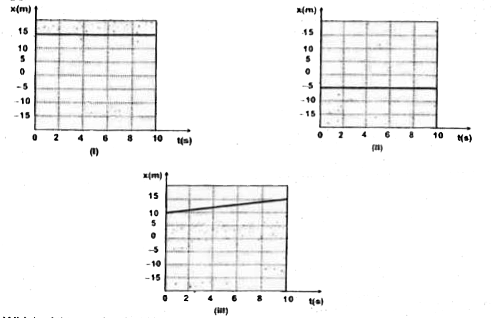
- Figure shows the position the graph for a particle in one dimensional ...
Text Solution
|
- Figure shows the position time graph for a particle in one dimensional...
Text Solution
|
- Figure given shows the distance - time graph of the motion of a car. I...
Text Solution
|
- चित्र में एक कण क स्थिति समय ग्राफ दर्शाया गया है। इस ग्राफ की विवेचना...
Text Solution
|
- एक समान गति करते हुए कण का वेग-समय ग्राफ तथा स्थिति-समय ग्रापु दर्शाइए...
Text Solution
|
- The displacement-time graph of a particle executing simple harmonic mo...
Text Solution
|
- The graph in Figure could be the graph of which of the following funct...
Text Solution
|
- Figure shows the acceleration-time graphs of a particle. Which of the ...
Text Solution
|