Text Solution
Verified by Experts
The correct Answer is:


Similar Questions
Explore conceptually related problems
Recommended Questions
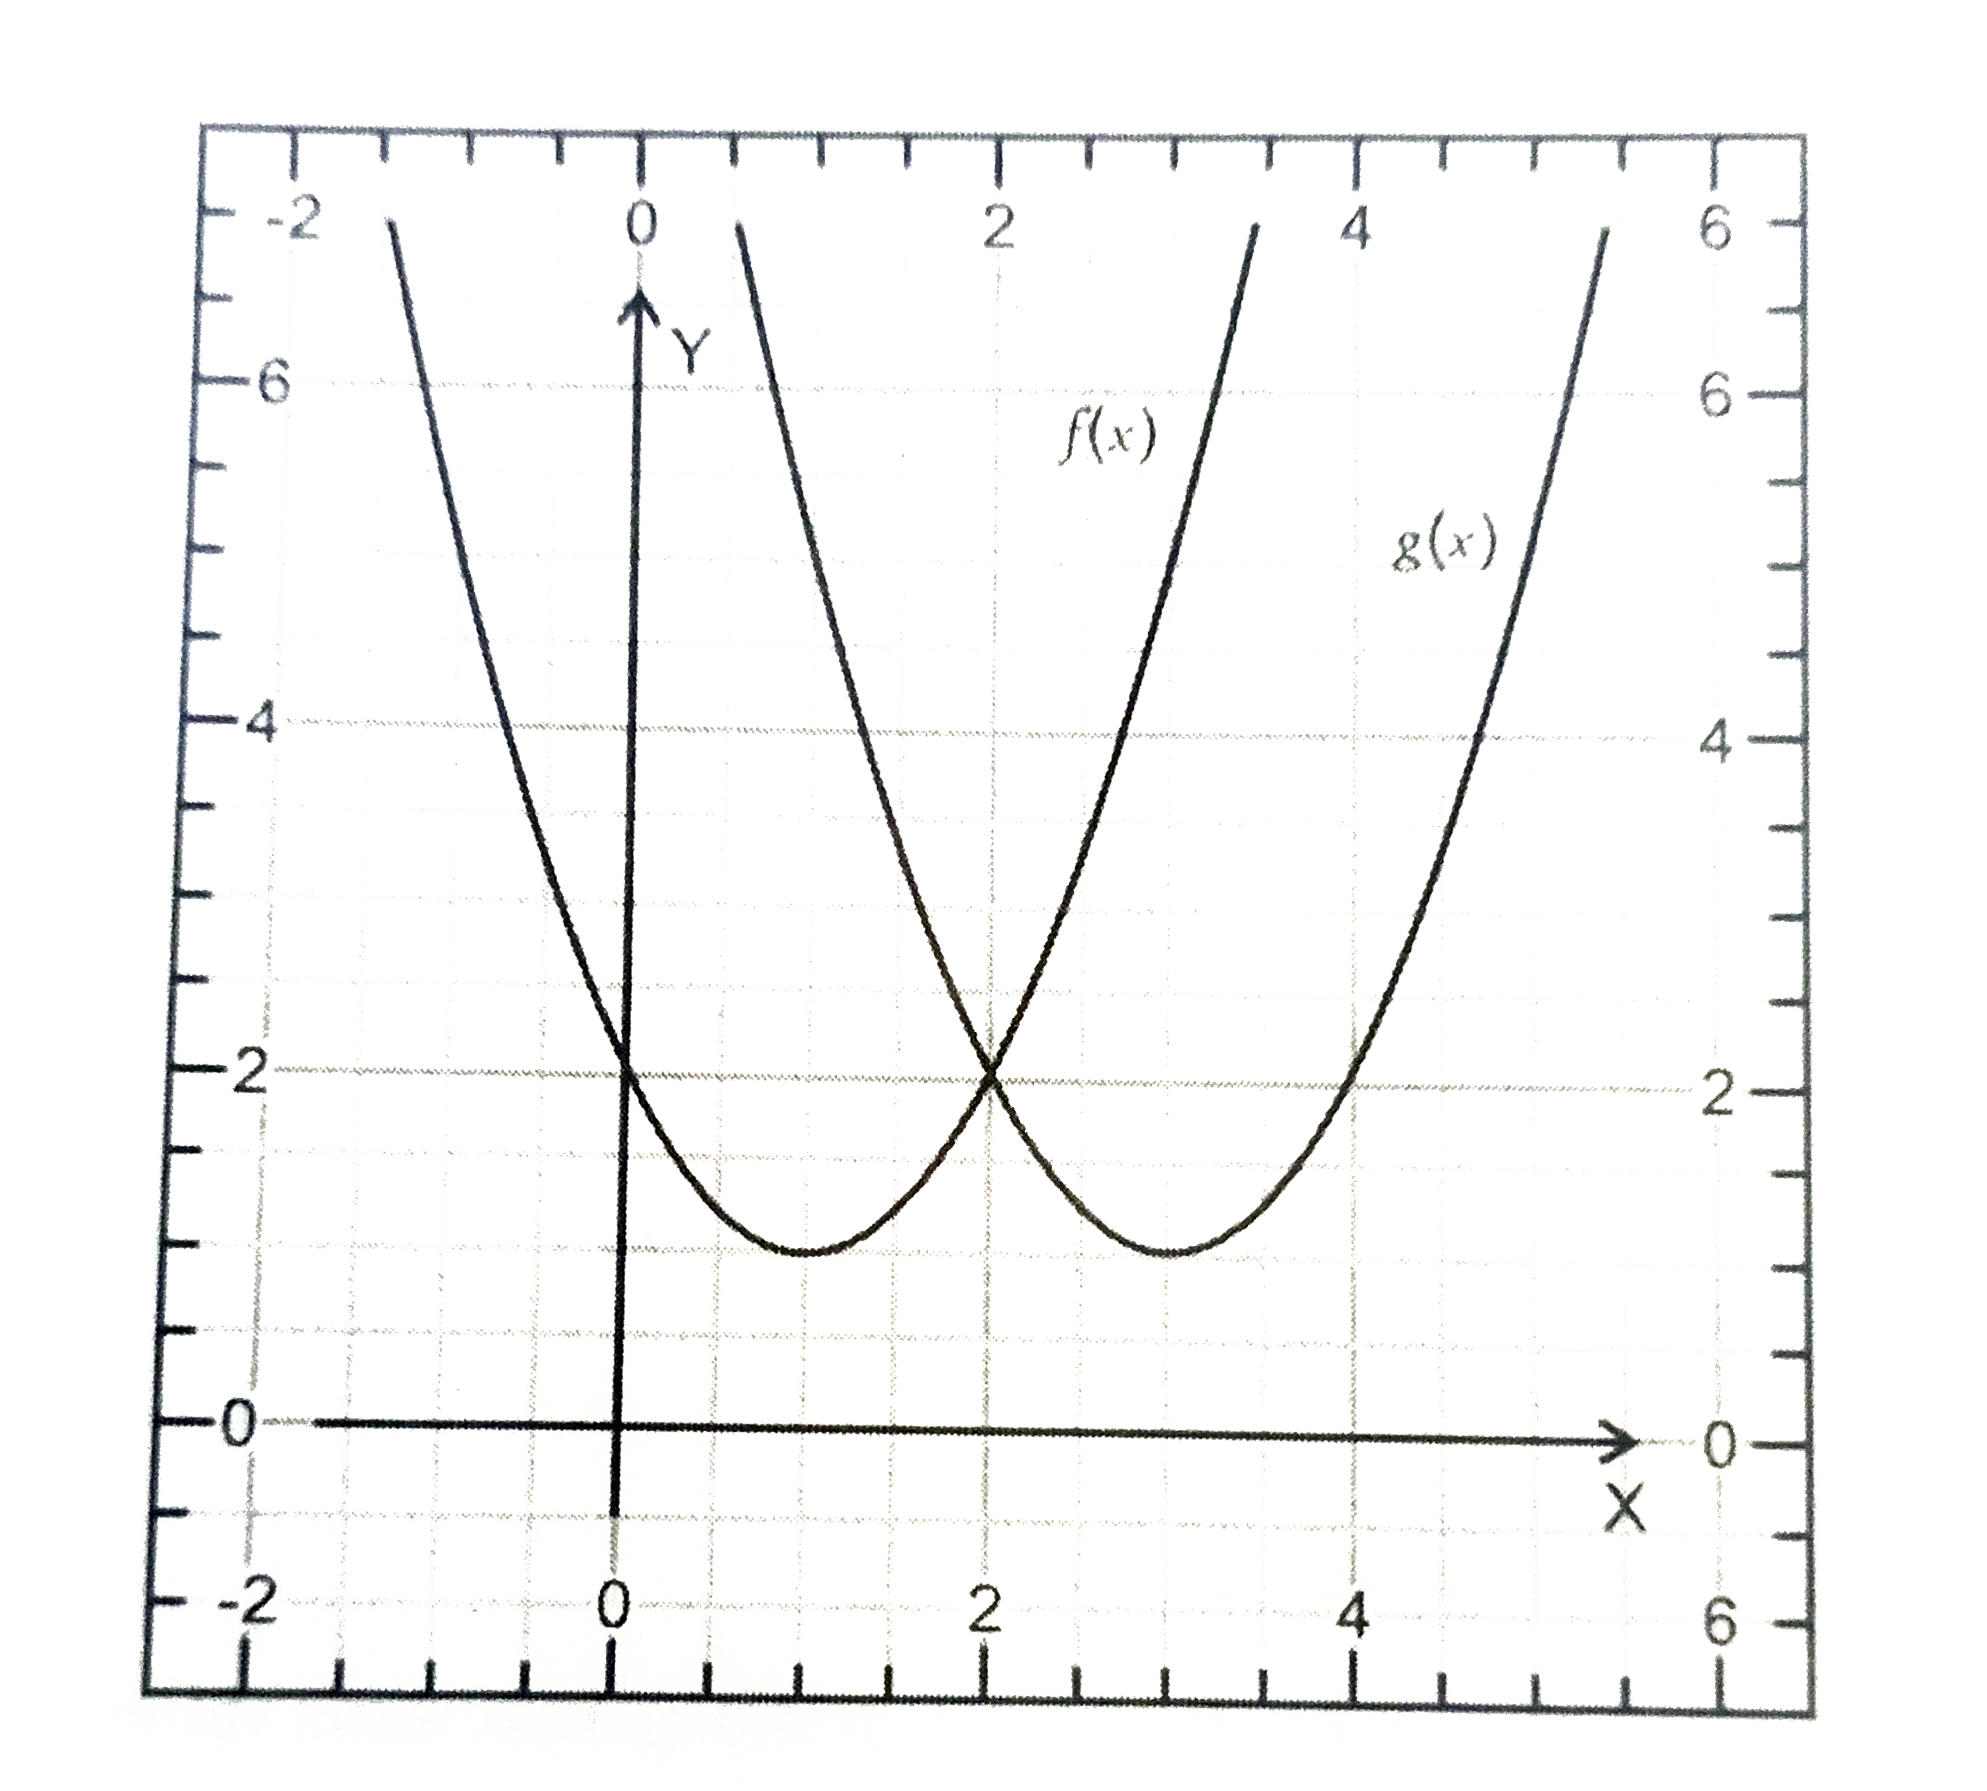
- The graph of f(x) and g(x) are shown below. Which option is true?
Text Solution
|
- If graph of y=f(x) is as shown in figure,then which of the following o...
Text Solution
|
- Consider the following function f whose graph is given below. Dra...
Text Solution
|
- The graph of function f (x) is shown below : Then the graph of g...
Text Solution
|
- The graph of g(x) is shown in the figure above. If h(x)=-g(x)+1, which...
Text Solution
|
- The graph of y=f(x) is shown below. Which of the following could ...
Text Solution
|
- The graph of f(x) is shown below : A transformation is applied t...
Text Solution
|
- The graph of f(x)=(3)/(x-5) is shown above: (##VIB343SATMATC04E0100...
Text Solution
|
- The graphs of f(x) and g(x) are shown below. Which option is true?
Text Solution
|