A
B
C
D
Text Solution
Verified by Experts
The correct Answer is:


Similar Questions
Explore conceptually related problems
Recommended Questions
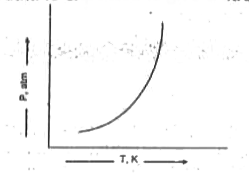
- The vapoure pressure of most substances increases with temperature as ...
Text Solution
|
- Which plot involving vapour pressure (VP) and absolute temperature res...
Text Solution
|
- Freundlich adsorption isotherm gives a straight line on plotting :
Text Solution
|
- For the two compounds, the vapour pressure of (i) at a particular temp...
Text Solution
|
- Assertion:A constant volume gas thermometer, reads temperature in term...
Text Solution
|
- In the graph plotted between vapour pressure (V.P.) and temperature (T...
Text Solution
|
- Assertion : At constant temperature PV vs P plot for real gases is not...
Text Solution
|
- Which the following sets of variable give a straight line with a negat...
Text Solution
|
- Vapour pressure diagram of some liquids plotted against temperature ar...
Text Solution
|