A
B
C
D
Text Solution
Verified by Experts
The correct Answer is:


Similar Questions
Explore conceptually related problems
Recommended Questions
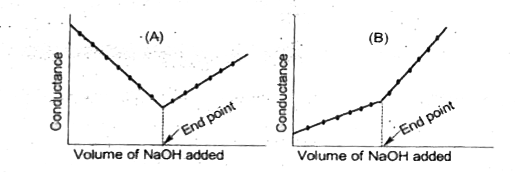
- Following two graphs are based on the conductometric titration of acid...
Text Solution
|
- Which of the following statements about a weak acid strong base titrat...
Text Solution
|
- which of the following plots will obtained for a conductometric titrat...
Text Solution
|
- Which one is the correct graph (fig.) for the corresponding acid base ...
Text Solution
|
- Go through the following flow sheet. Based on, it answer the questions...
Text Solution
|
- Redox Reaction | Acid-Base Titration
Text Solution
|
- Answer the questions based on the given truth table. Answer the follow...
Text Solution
|
- which of the following plots will obtained for a conductometric titrat...
Text Solution
|
- The graph represents the titration curve for : a.Strong acid and stro...
Text Solution
|