


Similar Questions
Explore conceptually related problems
Recommended Questions
- The velocity-time graph of a moving object is given in the figure. Dra...
Text Solution
|
- The acceleration versus time graph of a particle moving in a straight ...
Text Solution
|
- Velocity versus displacement graph of a particle moving in a straight ...
Text Solution
|
- Velocity versus displacement graph of a particle moving in a straight ...
Text Solution
|
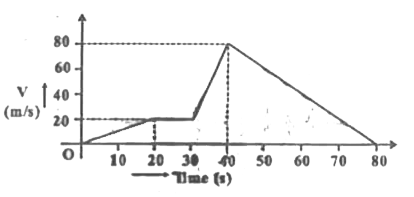
- Velocity-time graph for a moving object is shown in the figure. Total ...
Text Solution
|
- A particle starts to move along a straight line. The acceleration vers...
Text Solution
|
- Draw displacement time and acceleration -time graph for the given velo...
Text Solution
|
- The figure-1.125 shows the acceleration versus time graph of a train. ...
Text Solution
|
- Acceleration versus time graph of a particle moving in a straight line...
Text Solution
|