A
B
C
D
Text Solution
Verified by Experts
The correct Answer is:


Similar Questions
Explore conceptually related problems
Recommended Questions
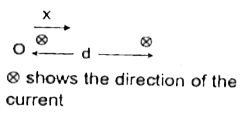
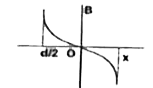
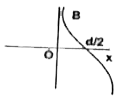
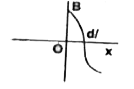
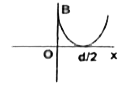
- Which graph approximately shows the plot of magnetic field (B) with x ...
Text Solution
|
- A cylinderical conductor of radius R is carrying constant current. The...
Text Solution
|
- What is the relation between magnetic field (B), current (I) and dista...
Text Solution
|
- Two long thin parallel conductors C and D of the shape as shown in fig...
Text Solution
|
- Find the magnitude of the magnetic field at the origin O due to very l...
Text Solution
|
- The figure shows a long straight current carrying conductor. Can you p...
Text Solution
|
- Mention the between a current carrying conductor and magnetic field fo...
Text Solution
|
- Which of the graphs shown below correctly represents the variation of ...
Text Solution
|
- Shown in the figure is a conductor carrying a current i. the magnetic ...
Text Solution
|