A
B
C
D
Text Solution
Verified by Experts
The correct Answer is:


Similar Questions
Explore conceptually related problems
Recommended Questions
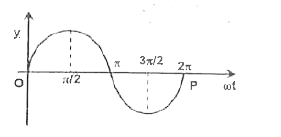
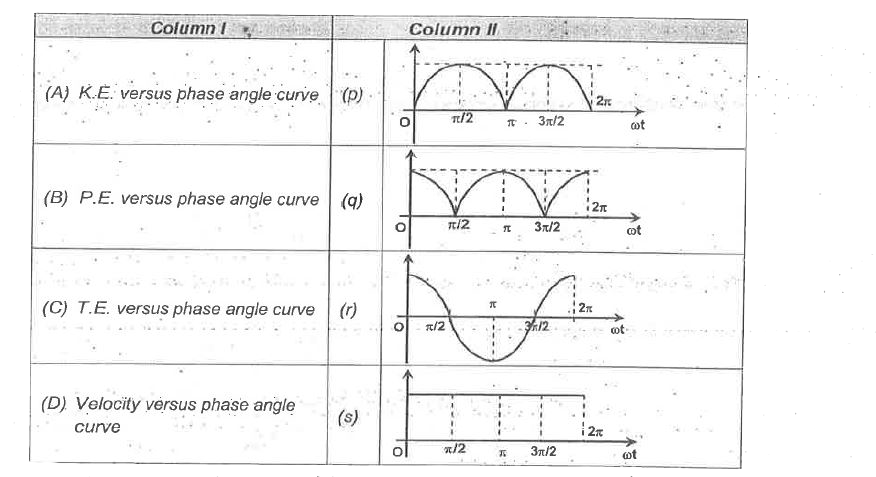
- The graph plotted between phase angle (omega t) and displacement of a ...
Text Solution
|
- The graph plotted between acceleration and displacement of a particle ...
Text Solution
|
- The displacement-time graph of a particle is as shown below. It indica...
Text Solution
|
- If a graph is plotted between velocity (v) and displacement (y) of a p...
Text Solution
|
- The displacement of a particle in S.H.M. is given by x= B "sin" (omega...
Text Solution
|
- A graph between velocity and displacement of a particle performing SHM...
Text Solution
|
- The graph plotted between phase angle (phi) and displacement of a part...
Text Solution
|
- The displacement of a particle in S.H.M. is x = a sin omega t . Which ...
Text Solution
|
- The speed - time graph of a particle moving along a solid curve is sho...
Text Solution
|