A
B
C
D
Text Solution
Verified by Experts
The correct Answer is:


Similar Questions
Explore conceptually related problems
Recommended Questions
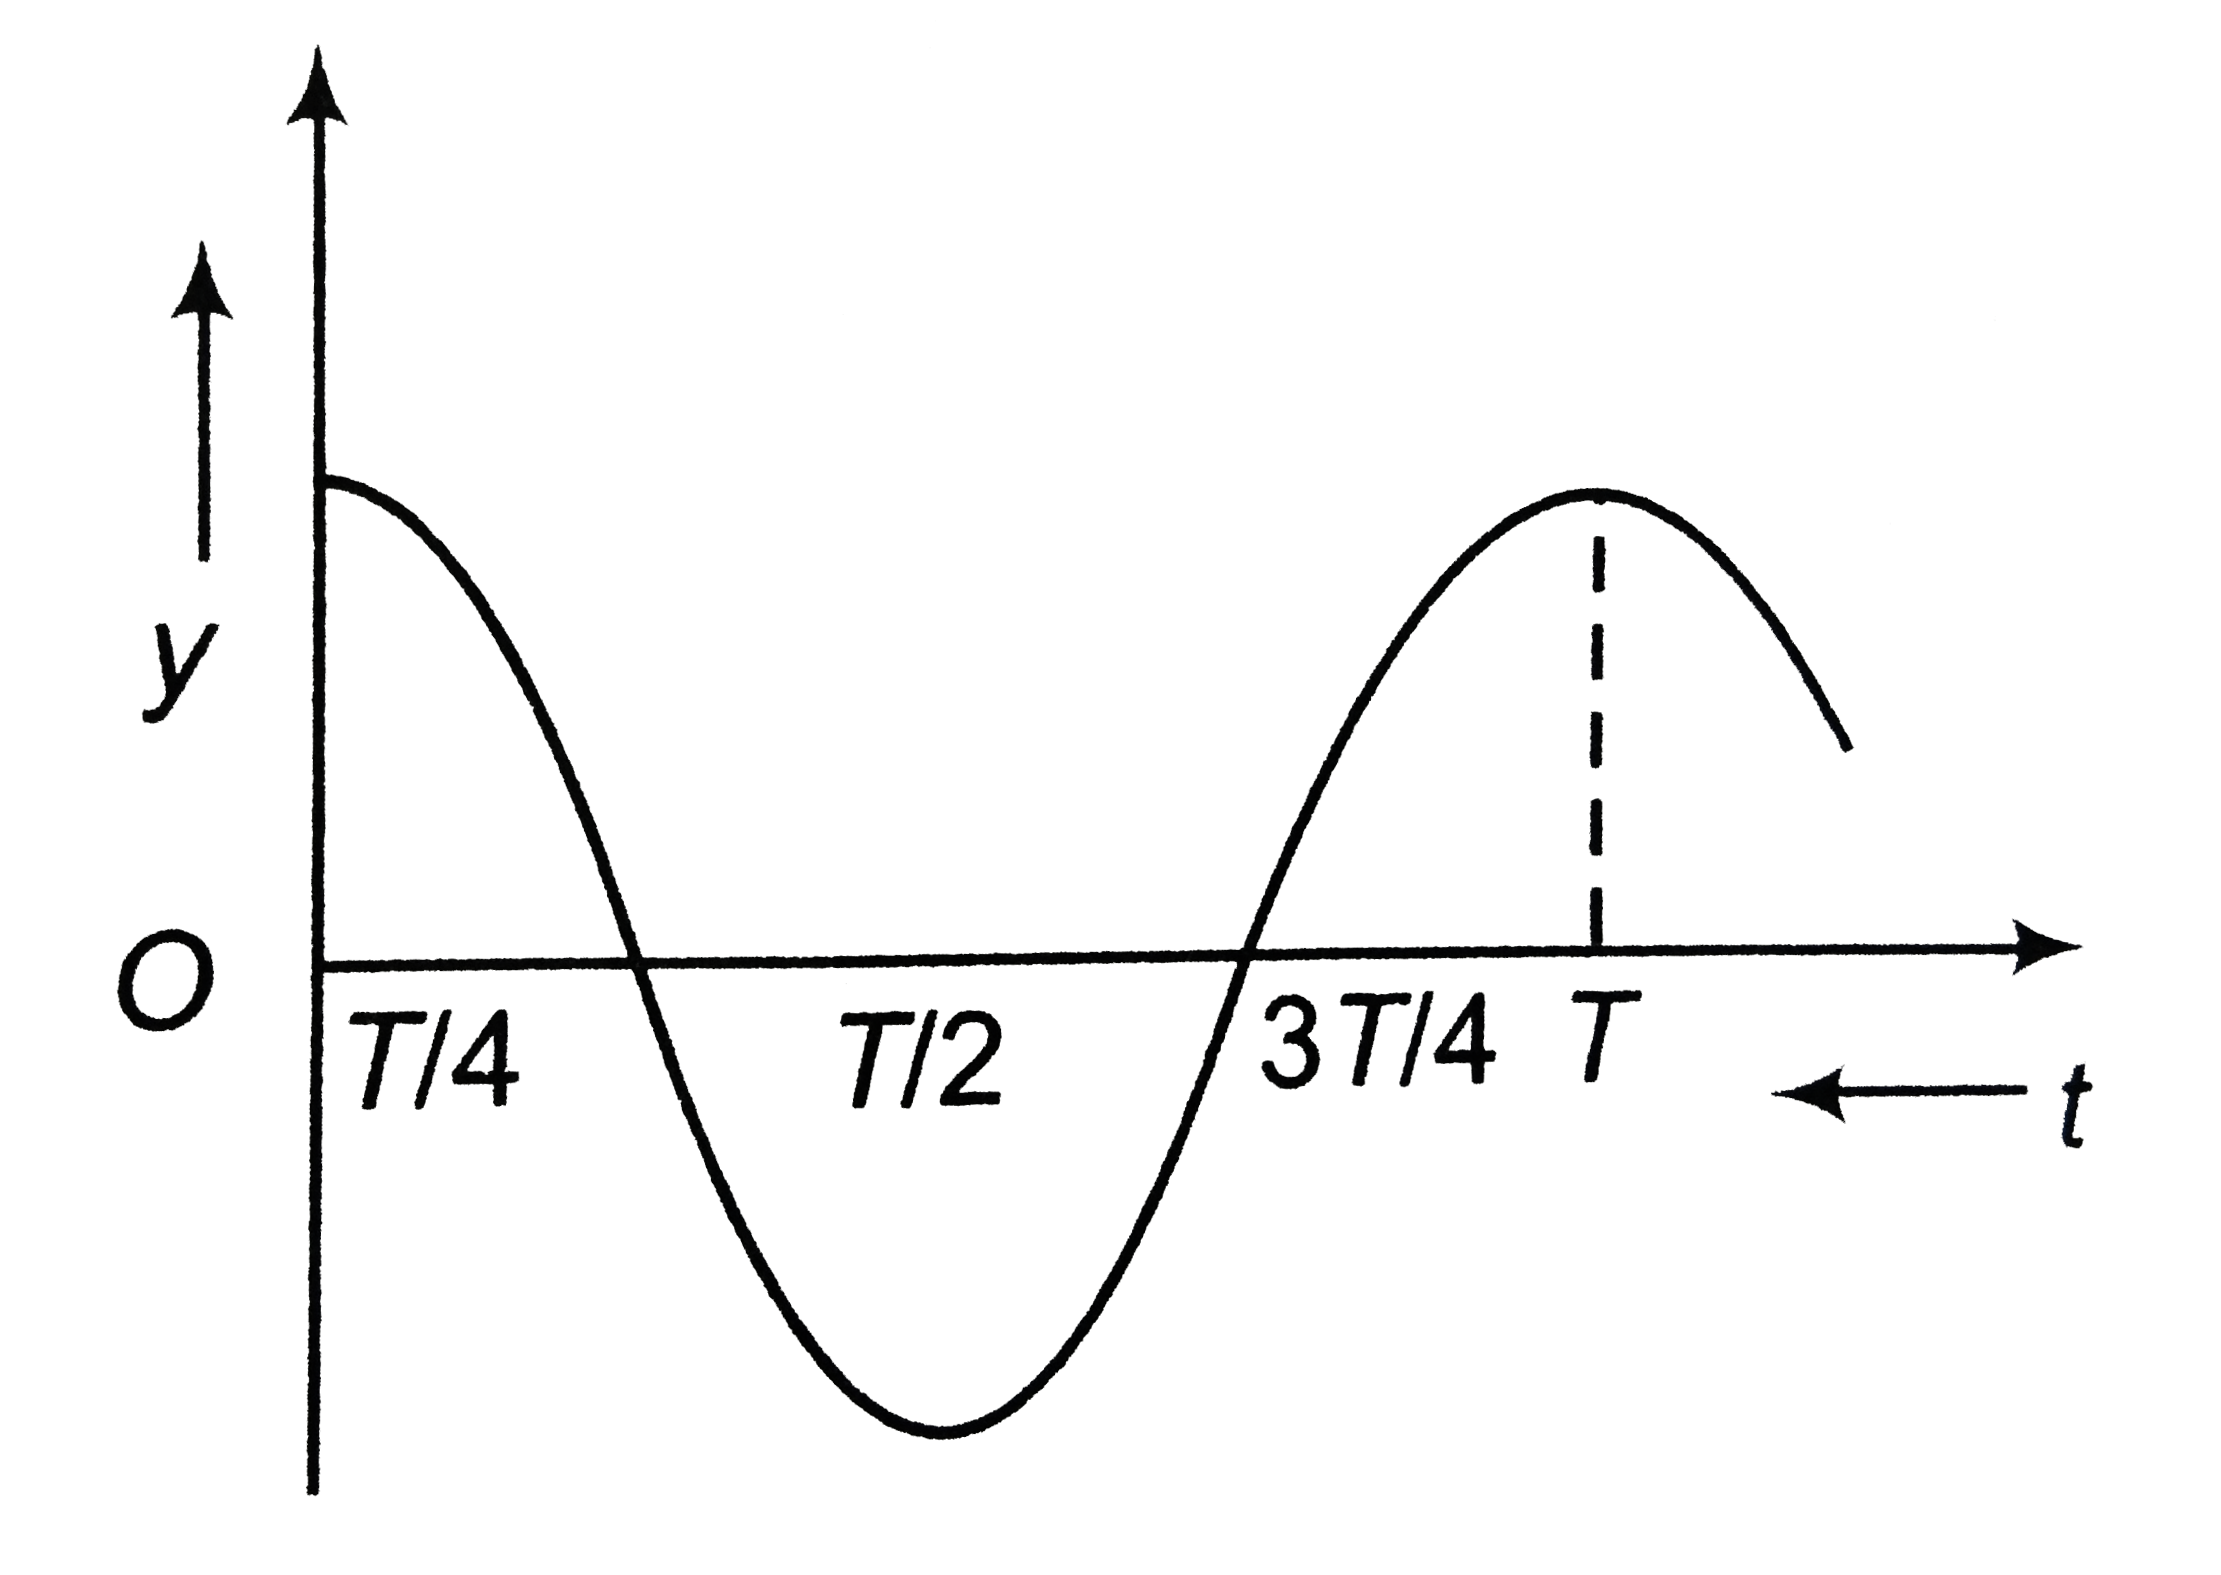
- The displacement - time graph of a particle executing SHM is shown in ...
Text Solution
|
- The displacement - time graph of a particle executing SHM is shown in ...
Text Solution
|
- The displacement time graph of a particle executing S.H.M. is shown in...
Text Solution
|
- The displacement -time graph of a particle executing SHM is shown in f...
Text Solution
|
- The displacement time graph of a particle executing S.H.M. (in straigh...
Text Solution
|
- Acceleration-displacement graph of a particle executing SHM Is as show...
Text Solution
|
- Displacement-time graph of a particle executing SHM is as shown T...
Text Solution
|
- The displacement-time graph of a particle executing SHM is shown in fi...
Text Solution
|
- The displacement-time graph for a particle executing SHM is as shown i...
Text Solution
|