Text Solution
Verified by Experts
The correct Answer is:


Similar Questions
Explore conceptually related problems
Recommended Questions
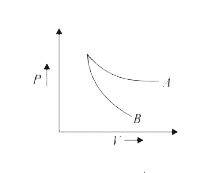
- The curves A and B in the figure show P-V graphs for an isothermal ...
Text Solution
|
- Can a process on an ideal gas be both adiabatic and isothermal. ?
Text Solution
|
- The curves A and B in the figure shown P-V graphs for an isothermal an...
Text Solution
|
- The ratio of slopes of P-V plots for reversible adiabatic process and ...
Text Solution
|
- Figure shows four PV diagrams. Which of these curves represent isother...
Text Solution
|
- Which of the following P-V curve best represents. As isothermal proces...
Text Solution
|
- निम्नलिखित कथन सत्य है अथवा असत्य? चित्र में दो वक्र A तथा B एक आदर्श...
Text Solution
|
- Which of the following P-V curve best represents. As isothermal proces...
Text Solution
|
- Draw P-V curves for isothermal and adiabatic processes of an ideal gas...
Text Solution
|