A

B
C
D

Text Solution
Verified by Experts
The correct Answer is:


Similar Questions
Explore conceptually related problems
Recommended Questions
- The correct M-H curve for a paramagnetic material at a constant tempe...
Text Solution
|
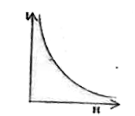
- The magnetic susceptibility of any paramagnetic material changes with ...
Text Solution
|
- The correct M-H curve for a paramagnetic material at a constant tempe...
Text Solution
|
- The graph between chi and T for paramagnetic material will be represen...
Text Solution
|
- The graph between chi and 1/T for paramagnetic material will be repres...
Text Solution
|
- The correct graph which shows the variation of paramagnetic susceptibi...
Text Solution
|
- For a paramagnetic material, the dependence of the magnetic susceptibi...
Text Solution
|
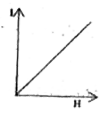
- The correct I - H graph for a paramagnetic material will look like .
Text Solution
|
- अनुचुम्बकीय पदार्थों के लिये निम्न में से कौन-सा वक्र सही है?
Text Solution
|