Home
Class 12
PHYSICS
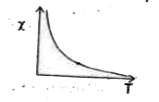
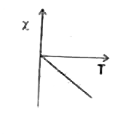
Which among the four chi versus T graphs...

Which among the four `chi` versus T graphs shown in the following figure is the correct one for a paramagnetic substsnace will look like ?

A

B

C

D

Text Solution

AI Generated Solution

The correct Answer is:
To determine the correct susceptibility (χ) versus temperature (T) graph for a paramagnetic substance, we can follow these steps: ### Step 1: Understand the relationship between susceptibility and temperature for paramagnetic substances. - For paramagnetic materials, the susceptibility (χ) is inversely proportional to the temperature (T). This means that as the temperature increases, the susceptibility decreases. ### Step 2: Analyze the behavior of susceptibility with temperature. - As temperature (T) increases, the thermal agitation of the magnetic dipoles in the paramagnetic material increases, which leads to a decrease in the alignment of these dipoles. Consequently, the susceptibility (χ) decreases. ### Step 3: Identify the correct graph. - Given the inverse relationship, the graph of susceptibility (χ) versus temperature (T) should show a downward trend as temperature increases. This means that the graph should slope downwards from left to right. ### Step 4: Compare the provided graphs. - Look at the four graphs provided in the question. The correct graph will show a clear decrease in susceptibility as temperature increases. ### Step 5: Select the correct option. - After analyzing the graphs, the third option is the one that correctly represents the inverse relationship between susceptibility and temperature for a paramagnetic substance. ### Final Answer: - The correct graph for a paramagnetic substance showing the relationship between susceptibility (χ) and temperature (T) is option number 3. ---
Promotional Banner

Similar Questions

Explore conceptually related problems

In the rho -T graph shown in figure, match the following.

In the V-T graph shown in figure match the following.

In the V-T graph shown in the figure match the following columns.

Which one is not correct for a cyclic process as shown in the figure ?

A projectile is projected with a velocity u at an angle theta with the horizontal. For a fixed theta , which of the graphs shown in the following figure shows the variation of range R versus u?

Velocity versus time graph of a body is shown in figure. It explains that

Which among the following is paramagnetic ?

For the figure shown, which one is correct?

Which of the following is an equation of the graph shown in Figure

In the circuit shown in the figure, which one of following statement is correct