Text Solution
Verified by Experts


Similar Questions
Explore conceptually related problems
Recommended Questions
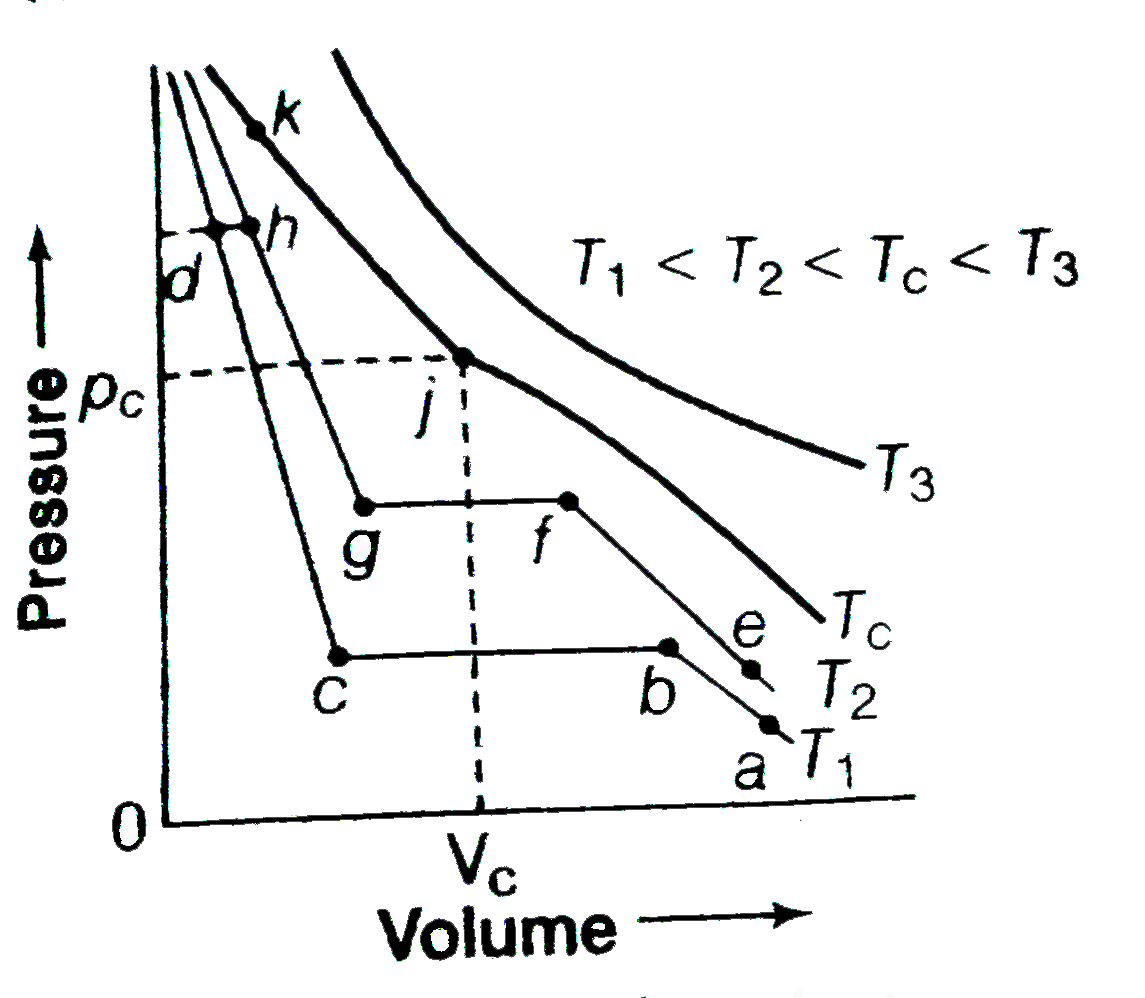
- Isotherms of carbon dioxide at various temperatures are repersented in...
Text Solution
|
- The figure shows the variation of V with i at temperatures T(1) and T(...
Text Solution
|
- The V - i graph for a conductor at temperature T(1) and T(2) are as sh...
Text Solution
|
- Isotherms of carbon dioxide at various temperature are represented in ...
Text Solution
|
- In following isothermal graphs A, B and C at temperatures T(1), T(2) a...
Text Solution
|
- In the P - V diagram, the point B and C correspond to temperatures T (...
Text Solution
|
- Isotherms of carbon dioxide at various temperatures are represented in...
Text Solution
|
- Isotherms of carbon dioxide at various temperatures are represented in...
Text Solution
|
- Isotherms of carbon dioxide at various temperatures are represented in...
Text Solution
|