Home
Class 14
MATHS
The following table gives the monthly ex...

The following table gives the monthly expenditure of two families

In constructing a pie diagram to the above data, the radi of the circles are to be chosen by which one of the following ration?

A

`1:1`

B

`10:9`

C

`100:91`

D

`5:4`

Text Solution

Verified by Experts

The correct Answer is:
B
Promotional Banner

Topper's Solved these Questions

  • STATISTICS

    PUNEET DOGRA|Exercise PRE YEAR QUESTIONS |163 Videos
  • SET & RELATION

    PUNEET DOGRA|Exercise PREV YEAR QUESTIONS|65 Videos
  • TRIGONOMETRY

    PUNEET DOGRA|Exercise PREV YEAR QUESTIONS|163 Videos

Similar Questions

Explore conceptually related problems

The following table gives the monthly expenditure of two families: In constructing a pie diagram to the above data, the radii of the circles are to be chosen by which one of the following ratios?

Following table shows the monthly expenditure of Imrans family on various items.

The following table shows the monthly expenditure of different families on different items : Represent the data in the form of a sub-divided bar diagram.

The following table shows the expenditure of a family whose monthly income is* 22,000. Represent the above data by a pie chart.

The following information gives the monthly salaries of 100 employees . Find the mode of the data .

The following pie-chart shows the monthly expenditure of a family on various items. If the family spends Rs. 825 on clothing, answer the question What is the total monthly income of the family?

The following pie chart represents a total expenditure of 540000 on different items in constructing a flat in a town. The expenditure (in ?) on bricks is

The following pie chart represents a total expenditure of 540000 on different items in constructing a flat in a town. The expenditure (inT)on cement is

The following pie diagram represents expenditure on different items in constructing a building. If the total construction cost of building is Rs. 5,40,000, answer the following questions: a. Find the central angle for labour expenditure. b. Find the expenditure on labour.

PUNEET DOGRA-STATISTICS-PRE YEAR QUESTIONS
  1. Which one of the following can be considered as appropriate pair of va...

    Text Solution

    |

  2. It is given that X=10, y=90 sigma(x) =3. sigma(y)=12 and r(xy) = 0.8 ...

    Text Solution

    |

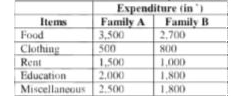
  3. The following table gives the monthly expenditure of two families ...

    Text Solution

    |

  4. If a variable tikes values 0. 1. 2. 3...n with frequencies 1. C(n, 1)...

    Text Solution

    |

  5. If x(1) and x(2) are positive quantities, then the condition for the...

    Text Solution

    |

  6. Consider the following statements 1. Variance is unaffected by chang...

    Text Solution

    |

  7. The coefficient of correlation when coefficients of regression are 0.2...

    Text Solution

    |

  8. If two regression lines between height (x) and weight (s) are 4y - 15 ...

    Text Solution

    |

  9. In an examination, 40% of candidates got second class. When the data a...

    Text Solution

    |

  10. Consider the following statements 1 Range is not a good measure of d...

    Text Solution

    |

  11. if the data are moderately non-symmetrical then which one of the follo...

    Text Solution

    |

  12. Match List 1 with List 2. Select the correct answer using the codes gi...

    Text Solution

    |

  13. Simplify :- 45% of 1770 ÷ 3 = 657 - ?

    Text Solution

    |

  14. If the regression coefficient of x and y on'x are -1/2 and -1/8 respec...

    Text Solution

    |

  15. A sample of 5 observations has mean 32 and median 33. Later it is foun...

    Text Solution

    |

  16. The variance of 20 observations is 5. If each observation is multiplie...

    Text Solution

    |

  17. The mean of a group of 100 observations was found to be 20. Later is f...

    Text Solution

    |

  18. The mean weight of 150 students in a certain class in 60kg. The mean w...

    Text Solution

    |

  19. Consider the following discrete frequency distribution what is the val...

    Text Solution

    |

  20. In a study of two groups, the following results were obtained Wh...

    Text Solution

    |