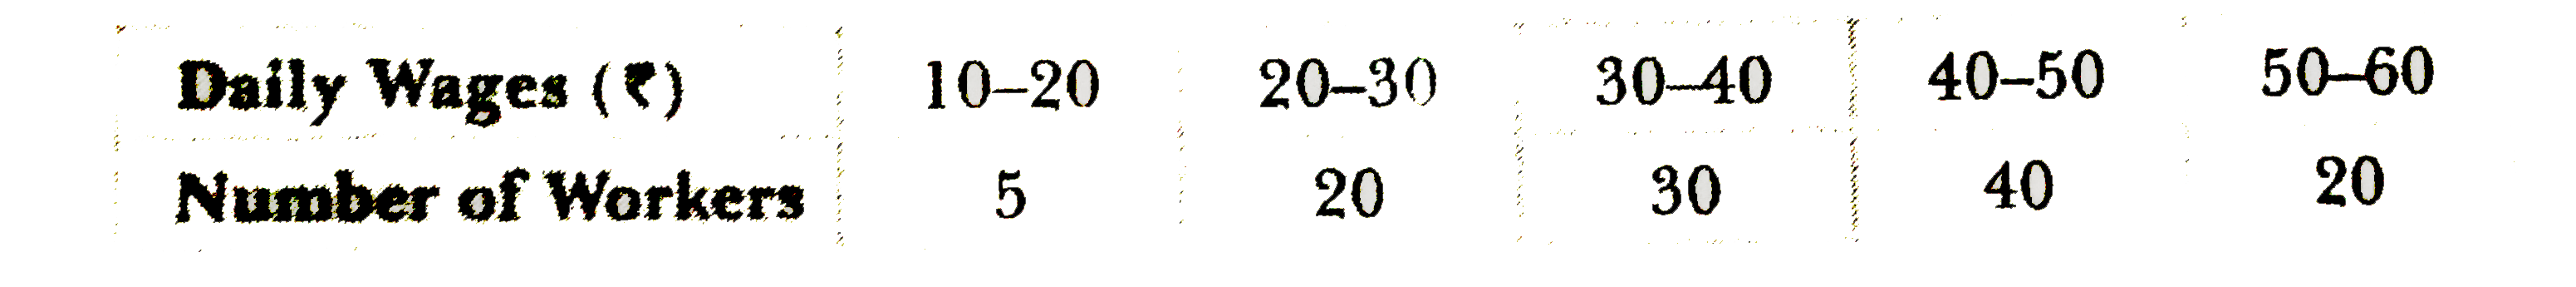
A
B
C
D
Text Solution
Verified by Experts
The correct Answer is:


Topper's Solved these Questions
Similar Questions
Explore conceptually related problems
PUNEET DOGRA-STATISTICS-PRE YEAR QUESTIONS
- The mean of 10 observations is 5. If 2 is added to each observation an...
Text Solution
|
- The median of 27 observations of a variable is 18 Three more observati...
Text Solution
|
- Represent the following data by frequency curve :
Text Solution
|
- What is the mean of n odd natural numbers. (a)n (b)(n+1)/(2) (c)(n(...
Text Solution
|
- The arithmetic mean of numbers a, b, c,d, e is M What is the value of ...
Text Solution
|
- The monthly family expenditure (in %) on n different items are follow...
Text Solution
|
- If the mean of few observation is 40 and standard deviation is 8. then...
Text Solution
|
- Which of the following is measure of dispersion?
Text Solution
|
- Let X and Y be two related variables. The two regression lines are giv...
Text Solution
|
- What is the mode for the data 20, 20, 20, 21, 21. 21, 21, 21, 22, 22, ...
Text Solution
|
- Consider the following statements: 1. Every composite number is a na...
Text Solution
|
- Consider the following statements: I Two independent variables are a...
Text Solution
|
- A variate X takes values 2, 9, 3, 7, 5, 4, 3, 2, 10.What is the median...
Text Solution
|
- What is the arithmetic mean of 16 natural numbers ?
Text Solution
|
- A variate X-takes values 2. 3. 4. 2. 5. 4 and 2 What is the mode?
Text Solution
|
- Which one of the following is the mean of the data given below:
Text Solution
|
- What is the mean ofthe given data? 2, 3, 4, 5, 6, 7, 8, 9
Text Solution
|
- Study the following table and asnwer question that follow: What ...
Text Solution
|
- Study the following table and asnwer question that follow: What...
Text Solution
|
- Study the following table and asnwer question that follow: What...
Text Solution
|