A
B
C
D
Text Solution
Verified by Experts
The correct Answer is:


Topper's Solved these Questions
Similar Questions
Explore conceptually related problems
PUNEET DOGRA-STATISTICS-PRE YEAR QUESTIONS
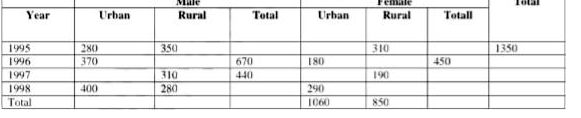
- Study the following table and asnwer question that follow: What ...
Text Solution
|
- Study the following table and asnwer question that follow: What...
Text Solution
|
- Study the following table and asnwer question that follow: What...
Text Solution
|
- Study the following table and asnwer question that follow: What...
Text Solution
|
- Study the following table and asnwer question that follow: What...
Text Solution
|
- Study the following table and asnwer question that follow: In w...
Text Solution
|
- Study the following table and asnwer question that follow: In w...
Text Solution
|
- Study the following table and asnwer question that follow: In w...
Text Solution
|
- Study the pie chart given below and answer the question that follow ...
Text Solution
|
- Study the pie chart given below and answer the question that follow ...
Text Solution
|
- What is the geometric mean of 10, 40 and 60?
Text Solution
|
- What is the median of the distribution 3, 7, 6, 9, 5,4, 2?
Text Solution
|
- The mean of 7 observation is 10 and that of 3 observations is 5. What ...
Text Solution
|
- Student of three sections of a class, having 30, 30 and 40 students ap...
Text Solution
|
- Some measure central tendency for a discrete observations are given be...
Text Solution
|
- The following table gives the continous frequency distribution of a co...
Text Solution
|
- The following table gives the continous frequency distribution of a co...
Text Solution
|
- If the regression coefficient of x and y on'x are -1/2 and -1/8 respec...
Text Solution
|
- The side of a cube measures 9 cm. What will be the diagonal of the cub...
Text Solution
|
- What is the cumulative frequency curve of statistical data commonly ca...
Text Solution
|