 : Draw a histogram to represent the given data.


Topper's Solved these Questions
STATISTICS
SWAN PUBLICATION|Exercise EXERCISE 14.4|7 VideosSTATISTICS
SWAN PUBLICATION|Exercise Objective Type Questions |16 VideosSTATISTICS
SWAN PUBLICATION|Exercise EXERCISE 14.2|15 VideosQUADRILATERALS
SWAN PUBLICATION|Exercise Objective Type Questions ( Fill in the Blanks)|10 VideosSURFACE AREAS AND VOLUMES
SWAN PUBLICATION|Exercise Objective Type Questions (Fill in the Blanks ) |7 Videos
Similar Questions
Explore conceptually related problems
SWAN PUBLICATION-STATISTICS -EXERCISE 14.3
- A survey conducted by an organisation for the cause of illness and dea...
Text Solution
|
- A survey conducted by an organisation for the cause of illness and dea...
Text Solution
|
- A survey conducted by an organisation for the cause of illness and dea...
Text Solution
|
- The following data on the number of girls (to the nearest ten) per tho...
Text Solution
|
- The following data on the number of girls (to the nearest ten) per tho...
Text Solution
|
- Given below are the seats won by different political parties in the po...
Text Solution
|
- Given below are the seats won by different political parties in the po...
Text Solution
|
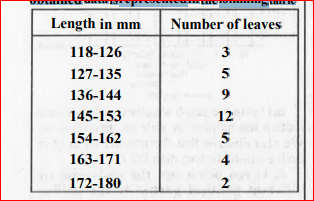
- The length of 40 leaves of a plant are measured correct to one millime...
Text Solution
|
- The length of 40 leaves of a plant are measured correct to one millime...
Text Solution
|
- The length of 40 leaves of a plant are measured correct to one millime...
Text Solution
|
- Complete the prime factor tree : .
Text Solution
|
- The following table gives the life times of 400 neon lamps: Life time ...
Text Solution
|
- The following table gives the distribution of students of two sections...
Text Solution
|
- The runs scored by two teams A and B in the first 60 balls in a cricke...
Text Solution
|
- Find x+y+z
Text Solution
|
- 100 surnames were randomly picked up from a local telephone directory ...
Text Solution
|
- 100 surnames were randomly picked up from a local telephone directory ...
Text Solution
|