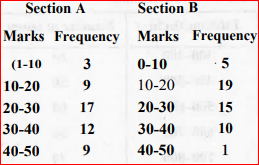
 : Represent the marks of the students of both the sections on the same graph by two frequency polygons. From the two polygons compare the performance of the twosections.


Topper's Solved these Questions
STATISTICS
SWAN PUBLICATION|Exercise EXERCISE 14.4|7 VideosSTATISTICS
SWAN PUBLICATION|Exercise Objective Type Questions |16 VideosSTATISTICS
SWAN PUBLICATION|Exercise EXERCISE 14.2|15 VideosQUADRILATERALS
SWAN PUBLICATION|Exercise Objective Type Questions ( Fill in the Blanks)|10 VideosSURFACE AREAS AND VOLUMES
SWAN PUBLICATION|Exercise Objective Type Questions (Fill in the Blanks ) |7 Videos
Similar Questions
Explore conceptually related problems
SWAN PUBLICATION-STATISTICS -EXERCISE 14.3
- A survey conducted by an organisation for the cause of illness and dea...
Text Solution
|
- A survey conducted by an organisation for the cause of illness and dea...
Text Solution
|
- A survey conducted by an organisation for the cause of illness and dea...
Text Solution
|
- The following data on the number of girls (to the nearest ten) per tho...
Text Solution
|
- The following data on the number of girls (to the nearest ten) per tho...
Text Solution
|
- Given below are the seats won by different political parties in the po...
Text Solution
|
- Given below are the seats won by different political parties in the po...
Text Solution
|
- The length of 40 leaves of a plant are measured correct to one millime...
Text Solution
|
- The length of 40 leaves of a plant are measured correct to one millime...
Text Solution
|
- The length of 40 leaves of a plant are measured correct to one millime...
Text Solution
|
- Complete the prime factor tree : .
Text Solution
|
- The following table gives the life times of 400 neon lamps: Life time ...
Text Solution
|
- The following table gives the distribution of students of two sections...
Text Solution
|
- The runs scored by two teams A and B in the first 60 balls in a cricke...
Text Solution
|
- Find x+y+z
Text Solution
|
- 100 surnames were randomly picked up from a local telephone directory ...
Text Solution
|
- 100 surnames were randomly picked up from a local telephone directory ...
Text Solution
|