


Topper's Solved these Questions
Similar Questions
Explore conceptually related problems
SWAN PUBLICATION-DATA HANDLING -MULTIPLE CHOICE QUESTIONS
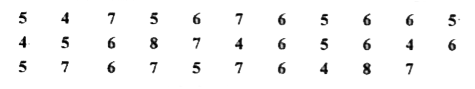
- Ekta is asked to collect data for size of shoes of students in her cla...
Text Solution
|
- If * represents 10 flowers then how many flowers does * * * * * repre...
Text Solution
|
- If = 7 children then what does represent ?
Text Solution
|
- What is value of
Text Solution
|
- If represents 400, then what does stand for ?
Text Solution
|
- ............ represents data through picture of objects.
Text Solution
|
- Which tally marks represents 14 ?
Text Solution
|
- If * represents 4 balls, No. of * to be drawn to represents 40 balls.
Text Solution
|
- ....................is method ofrepresenting the data in uniform width...
Text Solution
|
- If on a-scale 1 unit = 200 then how much quantity does 5 units will re...
Text Solution
|