Home
Class 8
MATHS
A survey was made to find the type of mu...

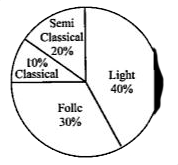
A survey was made to find the type of music that a certain group of young people liked in a city. Adjoining pie chart shows the findings of this survey.

Find this pie chart answer the following
(i) If 20 people liked classical music, how many young people were surveyed?
(ii) Which type of music is liked by the maximum number of people?
(iii) If a cassette company were to make 1000 CD's how many of each type would they make?

Text Solution

Verified by Experts

The correct Answer is:
200
Doubtnut Promotions Banner Mobile Dark
|

Topper's Solved these Questions

  • DATA HANDLING

    SWAN PUBLICATION|Exercise Exercise 5.3|13 Videos
  • DATA HANDLING

    SWAN PUBLICATION|Exercise Exercise 5.1|12 Videos
  • CUBES AND CUBE ROOTS

    SWAN PUBLICATION|Exercise EXERCISE 7.2|9 Videos
  • DIRECT AND INVERSE PROPORTIONS

    SWAN PUBLICATION|Exercise Exercise 13.2|16 Videos

Similar Questions

Explore conceptually related problems

Which types of music is liked by the maximum number of people ?

A survey was made to find the type of music that a certain group of young people liked in a city. Adjoining pie chart shows the findings of this survey. From this pie chart answer the following : Which type of music is liked by the maximum number of people ?

Knowledge Check

  • Formula to find the central angle of the sector in a pie chart is

    A
    `("frequency of the variable")/("Total frequency")xx360`
    B
    `("Total frequency")/("frequency of the variable")xx360^(@)`
    C
    `("frequency of the variable")/("Total frequency")xx180^(@)`
    D
    None
  • Similar Questions

    Explore conceptually related problems

    A survey was made to find the type of music that a certain group of young people liked in a city. Adjoining pie chart shows the findings of this survey. From this pie chart answer the following: Which type of music is liked by the maximum number of people?

    A survey was made to find the type of music that a certain group of young people liked in a city. Adjoining pie chart shows the findings of this survey. From this pie chart answer the following : If a cassette company were to make 1000 CD's how many of each type would they make ?

    Draw the pie clart showing the following information. The table shows the colours prefered by a group of people.

    Draw a pie chart for the following data. Number of students studying languages in a school.

    The bar graph given in the adjoining figure represents the various age groups of people in a town.Study the bar graph and answer the following questions: Total number of people in the age 1-89. .

    The bar graph given in the adjoining figure represents the various age groups of people in a town.Study the bar graph and answer the following questions: Write the no. of people in the oldest age group?

    The bar graph given in the adjoining figure represents the various age groups of people in a town.Study the bar graph and answer the following questions: Write the no. of people in the youngest age group? .