Text Solution
Verified by Experts
The correct Answer is:


Topper's Solved these Questions
Similar Questions
Explore conceptually related problems
SWAN PUBLICATION-DATA HANDLING-Exercise 5.2
- A survey was made to find the type of music that a certain group of yo...
Text Solution
|
- Which types of music is liked by the maximum number of people ?
Text Solution
|
- If a cassette company were to make 1000 CD's, how many of each type wo...
Text Solution
|
- A group of 360 people were asked to vote for their favourite season fr...
Text Solution
|
- A group of 360 people were asked to vote for their favourite season fr...
Text Solution
|
- A group of 360 people were asked to vote for their favourite season fr...
Text Solution
|
- Draw a Pie-chart showing the following information.The table sohws the...
Text Solution
|
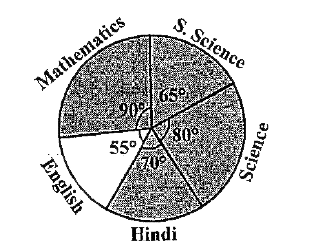
- The adjoining pie chart gives the marks secored in an examination by a...
Text Solution
|
- The adjoining pie chart gives the marks scored in an examination by a ...
Text Solution
|
- The adjoining pie chart gives the marks secored in an examination by a...
Text Solution
|
- The number of students in a hostel,speaking different languages is giv...
Text Solution
|