Text Solution
Verified by Experts
The correct Answer is:


Topper's Solved these Questions
Similar Questions
Explore conceptually related problems
SWAN PUBLICATION-INTRODUCTION TO GRAPHS -Exercise 15.3
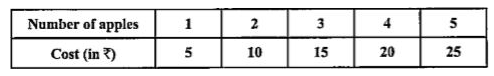
- Draw the graphs for the following tables of values , with sui...
Text Solution
|
- Draw the graphs for the following tables of value ,with suitable scale...
Text Solution
|
- Draw the graphs for the following tables of value ,with suitable scale...
Text Solution
|
- Draw the graphs for the following tables of value ,with suitable scale...
Text Solution
|
- Draw the graphs for the following tables of value ,with suitable scale...
Text Solution
|
- Draw the graphs for the following tables of value ,with suitable scale...
Text Solution
|
- Draw a graph for the following: Is it a linear graph ?
Text Solution
|
- Draw a graph for the following: Is it a linear graph ?
Text Solution
|